Figure 2.

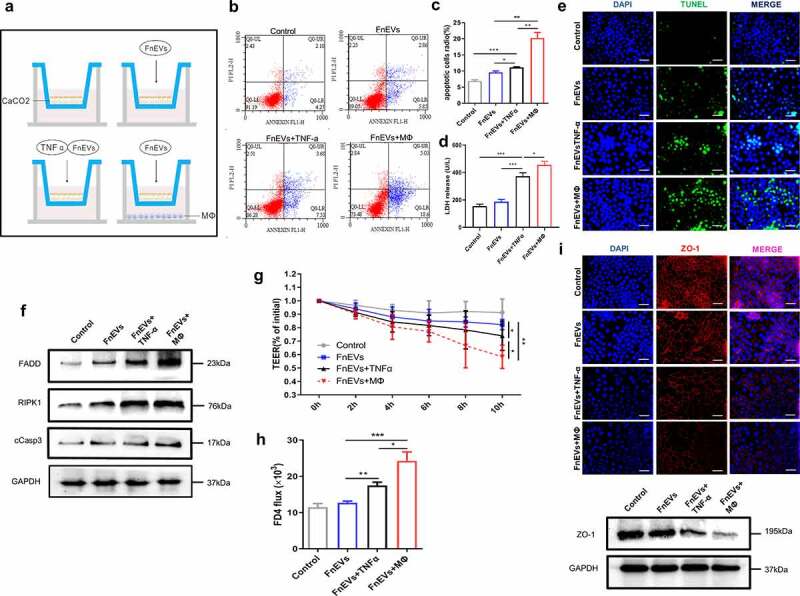
FnEVs promote TNF-α induced Caco2 cells death and barrier loss. (a) Diagram of groups. (b) Apoptosis was analyzed by using the annexin V FITC/PI assay. (c) Bar graphs show the relative mean of Caco2 cells apoptosis rate in different view fields. (d) The releasing levels of LDH were detected. (e) Representative images of TUNEL stainings of Caco-2 cells (green, TUNEL positive; blue, DAPI). Scale bar = 50 um. (f) Immunoblot analysis of protein extracts from Caco2 cells with the indicated antibodies. (g) Caco-2 cells were plated on a permeable membrane for TEER at different time points. (h) FITC-dextran flux was measured using Caco-2 cells grown to maximum TEER. (i) Immunofluorescence results of immunofluorescence localization of the TJ protein ZO-1(red, ZO-1 positive; blue, DAPI) and immunoblot analysis of ZO-1 protein. Scale bar = 50 um. *p < .05, **p < .01, ***p < .001. All the results were repeated three times. All data were presented as means ± SD (n = 3). TEER, transepithelial electrical resistance measurements
