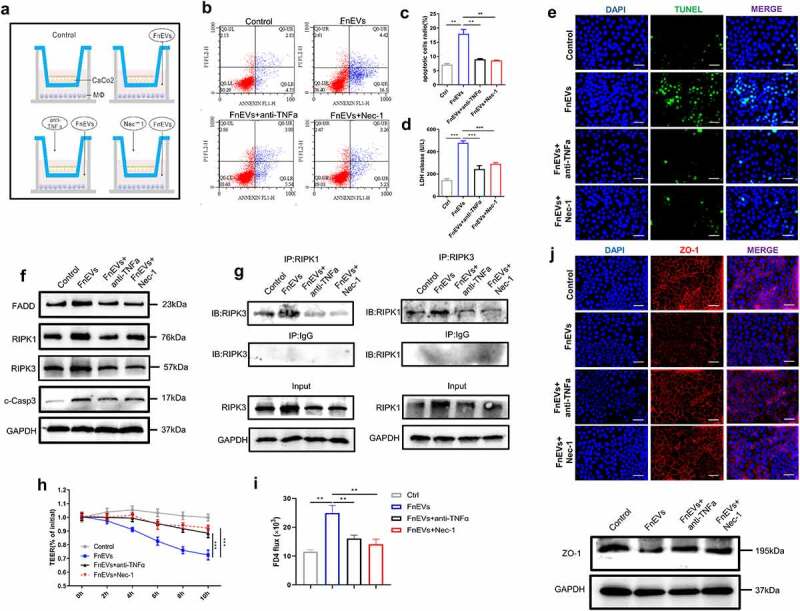
Figure 3.

FnEVs potentiate caco-2 cells barrier loss through RIPK1-mediated cell death pathway. (a) Diagram of groups. (b) Apoptosis was analyzed by using the annexin V FITC/PI assay. (c) Bar graphs show the relative mean of Caco-2 cells apoptosis rate in different view fields. (d) The releasing levels of LDH were detected. (e) Representative images of TUNEL stainings of Caco-2 cells (green, TUNEL positive; blue, DAPI). Scale bar = 50 um. (f) Immunoblot analysis of protein extracts from Caco-2 cells with the indicated antibodies. (g) Immunoprecipitation of RIPK3 with its antibody caused coimmunoprecipitation of RIPK1 in Caco-2 cells. (h) Caco-2 cells were plated on a permeable membrane for TEER at different time points. (i) FITC-dextran flux was measured using Caco-2 cells grown to maximum TEER. (j) Representative images of localization of the TJ protein ZO-1(red, ZO-1 positive; blue, DAPI) stainings of Caco-2 cells and immunoblot analysis of ZO-1 protein. Scale bar = 50 um. *p < .05, **p < .01, ***p < .001. All the results were repeated three times. All data were presented as means ± SD (n = 3). TEER, transepithelial electrical resistance measurements
