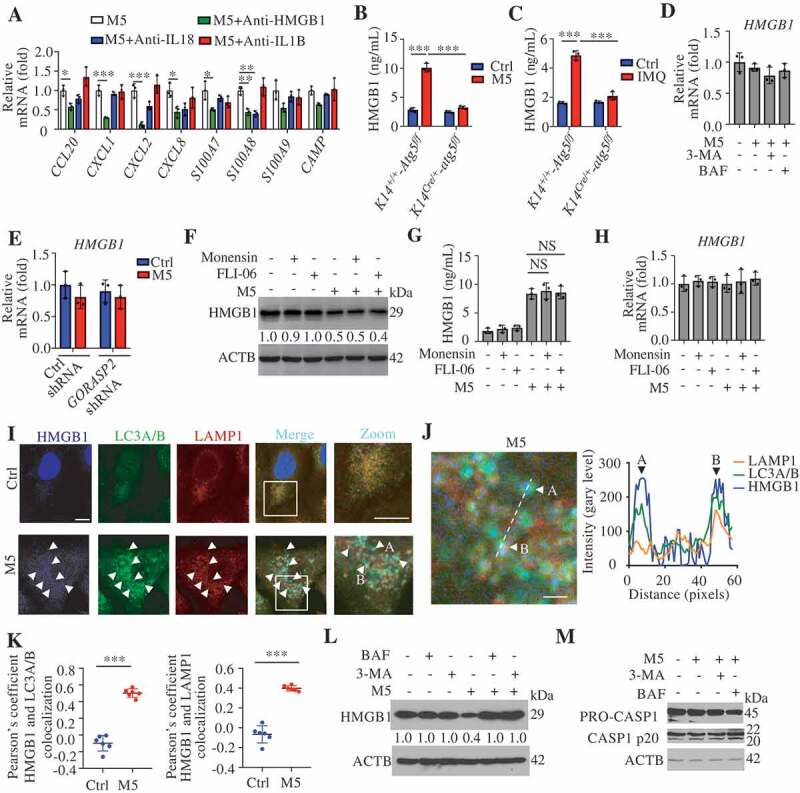
Figure 6.

Autophagy-based unconventional secretion of HMGB1 in psoriasiform KCs. (A) NHEK cells were stimulated with M5 for 24 h in the absence or presence of HMGB1-neutralizing antibody (anti-HMGB1,10 µg/mL), IL18- or IL1B-neutralizing antibody (anti-IL18,10 µg/mL; anti-IL1B, 10 µg/mL). The indicated genes levels were assayed by qRT-PCR, n = 3/group. (B) ELISA analysis of HMGB1 levels in cell culture supernatants of Krt14+/+-Atg5f/f and Krt14Cre/+-atg5f/f primary murine keratinocytes treated with M5 for 48 h, n = 3/group. (C) ELISA analysis of HMGB1 levels in serum from Krt14+/+-Atg5f/f and Krt14Cre/+-atg5f/f mice treated with IMQ for 5 d, n = 3/group. (D) NHEKs were pre-treated with or without 3-methyladenine (3-MA; 4 h, 10 mM), bafilomycin A1 (BAF; 4 h, 200 nM) or wortmannin (WOR; 4 h, 100 nM), and stimulated with or without M5 for 24 h. The HMGB1 gene expression levels were assayed by qRT-PCR, n = 3/group. (E) Ctrl shRNA HaCaT cells and GORASP2 shRNA HaCaT cells were stimulated with or without M5 for 24 h. HMGB1 gene expression levels were assayed by qRT-PCR, n = 3/group. (F-H) HaCaT cells were stimulated with M5 for 24 h or 48 h in the absence or presence of monensin (10 μM, 3 h) or FLI-06 (10 μM, 3 h), the blockers of Golgi transport in conventional secretion pathway. n = 3/group. (F) Representative immunoblots of HMGB1 in cell lysates at 48 h. (G) Analysis of HMGB1 levels in the culture medium by ELISA at 48 h. (H) qRT-PCR analysis of HMGB1 expression at 24 h. (I) HMGB1-EBFP2-transfected HaCaT cells were treated with M5, and representative confocal images of immunofluorescence of LC3A/B and LAMP1 are shown. Scale bars: 10 μm. (J) Line tracings, analysis of fluorescence signal intensity from images in (I), scale bars: 2 μm. (K) Pearson’s colocalization coefficient for HMGB1 and LC3A/B, HMGB1 and LAMP1. (L and M) Representative immunoblots of the indicated proteins in the cell lysates of NHEKs that were pretreated with or without 3-MA (4 h, 10 mM), BAF (4 h, 200 nM), and stimulated with or without M5 for 48 h. ACTB was used as a loading control (F, L and M). Mean ± SD. *P < 0.05; **P < 0.01; ***P < 0.001. One-way ANOVA (A-E, G and H), Two-tailed Student’s T-test (K). All the data are representative of three independent experiments
