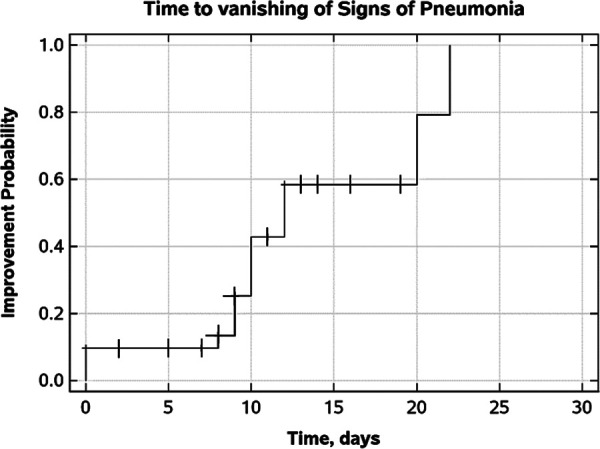
Figure 6.

Time-to-event analysis of pneumonia symptoms dynamics during treatment and follow-up periods.a
aObservations from patients who retained pneumonia signs (n=15) were denoted by crosses, disappearance of pneumonia in patients with improvement, evidenced by computed tomography scan and X-ray (n=16), was shown by steps.
