
Figure 6. H2A C-terminal tail dynamics in E3-E2/nucleosome complexes.
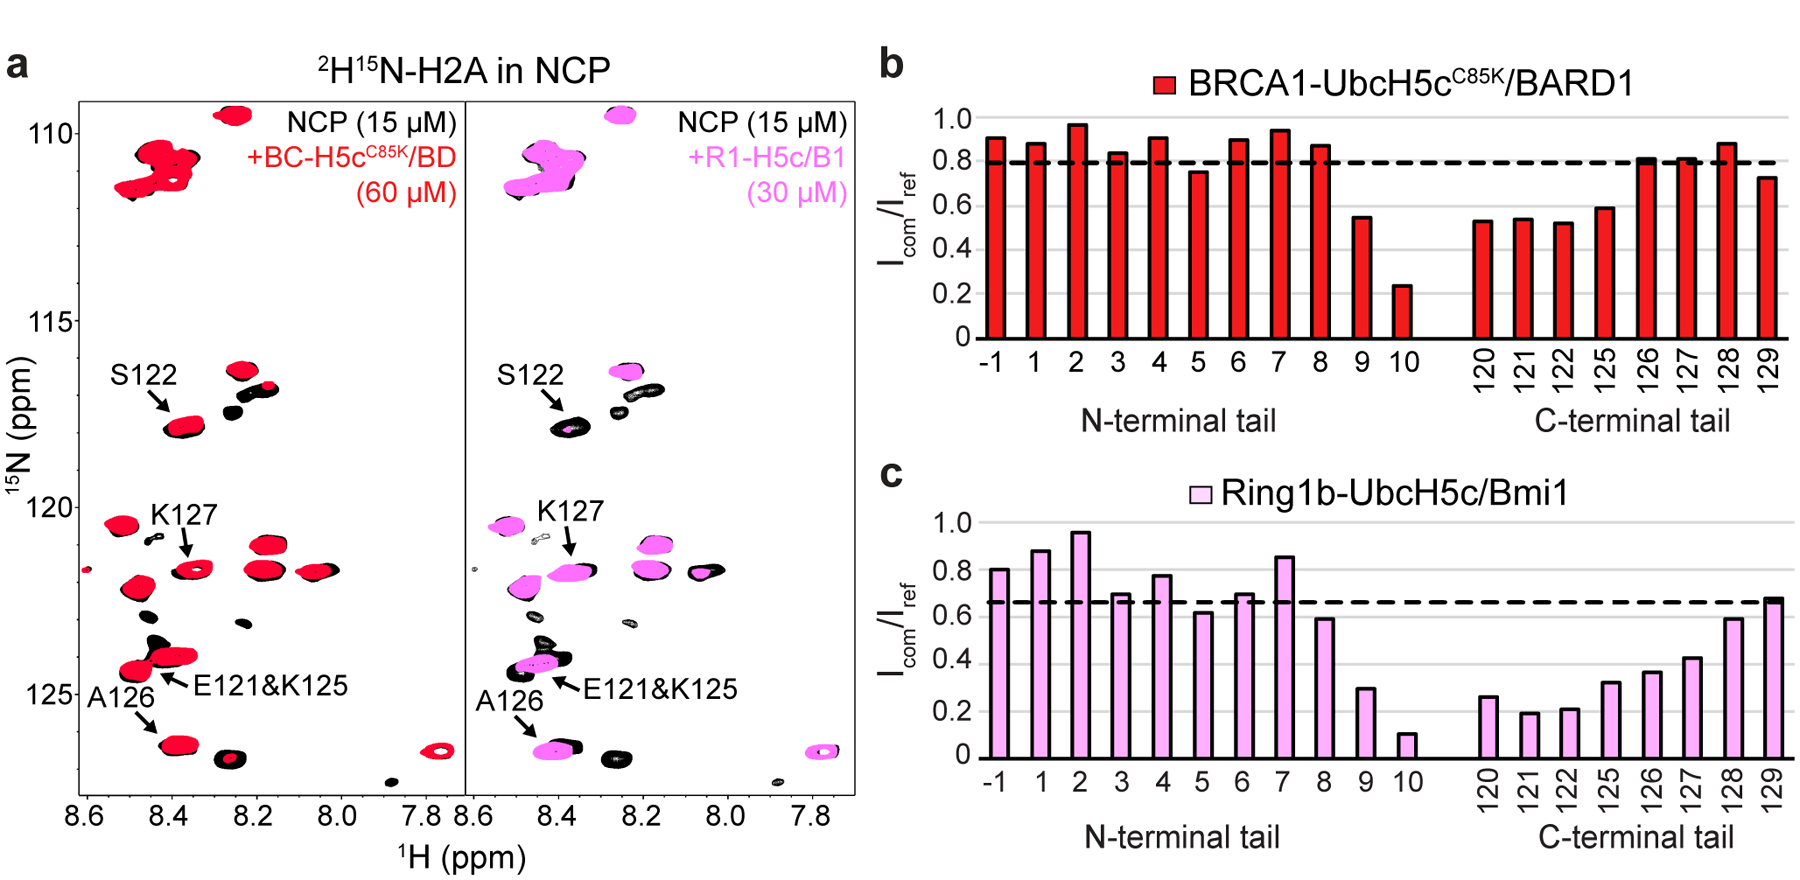
(a) Overlay of 1H15N-TROSY-HSQC spectra of 2H15N-H2A in the NCP (black, both panels), with BRCA1-UbcH5cC85K/BARD1 added (red, left panel), or Ring1b-UbcH5c/Bmi1 added (pink, right panel). Binding experiments were performed using 15 μM 2H15N-H2A NCPs with 60 μM BRCA1-UbcH5cC85K/BARD1 or 30 μM Ring1b-UbcH5c/Bmi1 added. Arrows in both panels identify signals from the H2A C-terminal tail that change position or have increased signal loss in the Ring1b-UbcH5c/Bmi1/nucleosome complex spectrum. (b) Quantification of H2A signal intensities from the BRCA1-UbcH5cC85K/BARD1/nucleosome complex in panel a comparing the bound complex spectrum to the apo reference spectrum (Icom/Iref). The trendline represents the mean broadening (Icom/Iref) from N-terminal tail residues −1–10. (c) Same analysis as in panel b for the Ring1b-UbcH5c/Bmi1/nucleosome complex. Data in panels b and c are representative of n=2 independent experiments. Data for graphs in b and c are available as source data.