
Figure.
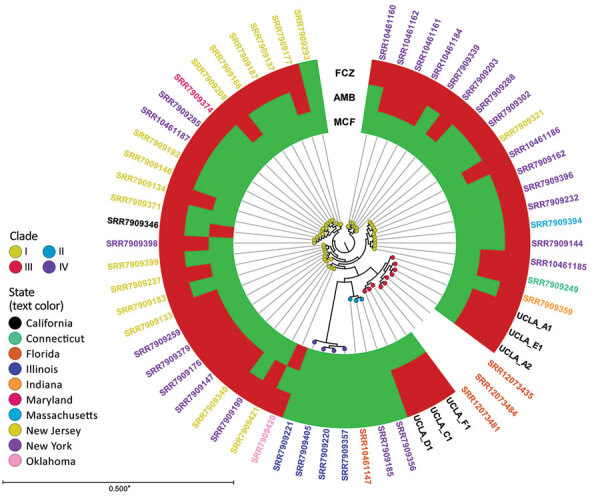
K-mer analysis of Candida auris isolates, United States, 2009–2020. K-mer analysis was conducted with CLC Genomics Workbench (QIAGEN, https://www.qiagen.com) using genome sequences from patients in Los Angeles, California, USA during 2019–2020 (i.e., UCLA_A1, UCLA_A2, UCLA_C1, UCLA_D1, UCLA_E1, and UCLA_F1) and 55 publicly available C. auris strains in GenBank (Appendix 2 Table 2). Each node represents a unique isolate. Node color indicates clade. The color of the isolate name (i.e., label text color) indicates state of origin. The metadata shows the susceptibility of each isolate (if available) to fluconazole (FCZ), amphotericin B (AMB), and micafungin (MCF); red indicates resistant, green indicates susceptible. Asterisk indicates that branches shorter than 0.0050 are shown as 0.0050.