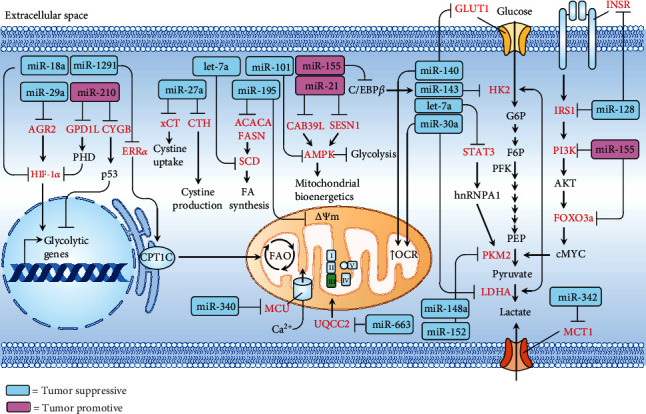
Figure 2.

Integrative network depicting that tumor-suppressive (blue rectangle) or tumor-promotive (pink rectangle) mitomiRs act on specific target genes (red) that are involved in metabolic reprogramming. ΔΨm: mitochondrial membrane potential; ACACA: acetyl-CoA carboxylase; AGR2: anterior gradient 2; AMPK: AMP-activated protein kinase; CAB39L: calcium-binding protein 39-like; C/EBPβ: CCAAT-enhancer-binding protein β; CPT1C: carnitine palmitoyltransferase 1C; CTH: cystathionine gamma-lyase; CYGB: cytoglobin; ERRα: estrogen-related receptor alpha; F6P: fructose 6-phosphate; FASN: fatty acid synthase; G6P: glucose 6-phosphate; GLUT1: glucose transporter 1; GPD1L: glycerol-3-phosphate dehydrogenase 1; HIF-1α: hypoxia-inducible factor 1-alpha; HK2: hexokinase 2; INSR: insulin receptor; IRS1: insulin receptor substrate 1; LDHA: lactate dehydrogenase A; MCT1: monocarboxylate transporter 1; MCU: mitochondrial calcium uniporter; mtDNA: mitochondrial DNA; mt-ROS: mitochondrial reactive oxygen species; OCR: oxygen consumption rate; PEP: phosphoenolpyruvate; PFK: phosphofructokinase; PI3K: phosphoinositide 3-kinases; PKM2: pyruvate kinase M1/2; SCD: stearoyl-CoA desaturase; SESN1: sestrin-1; STAT3: signal transducers and activators of transcription 3; UQCC2: ubiquinol-cytochrome c reductase complex assembly factor 2; xCT: cystine/glutamate transporter.
