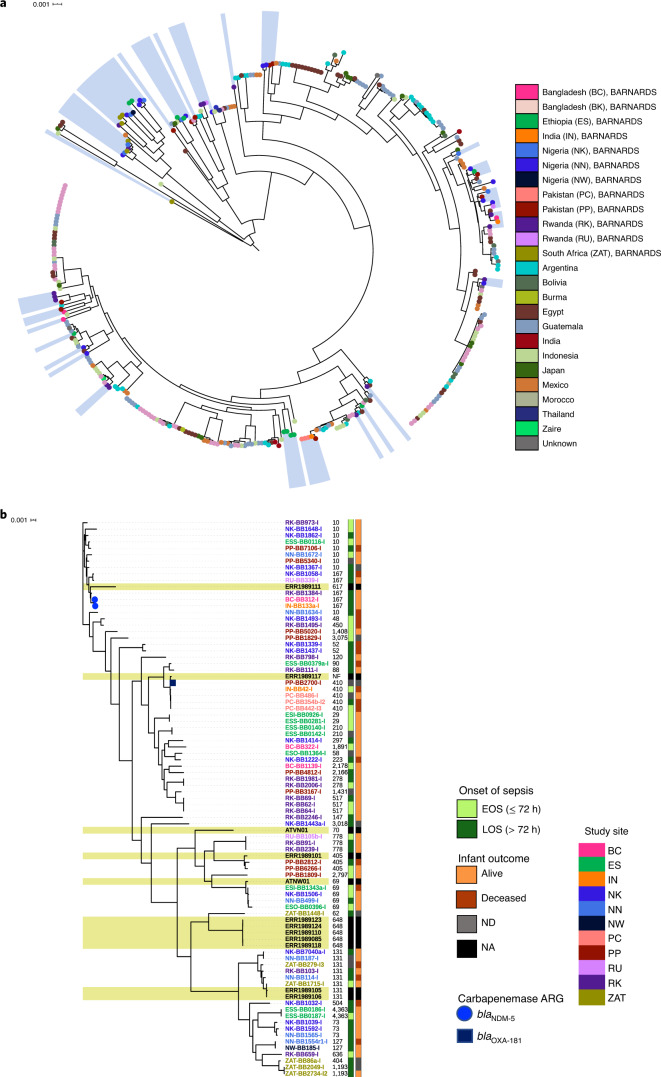
Fig. 6. Core genome characterization of E. coli isolates.
a, Three-hundred-and-sixty isolates incorporating a global collection28. Blue shading indicates E. coli isolates from the BARNARDS collection (n = 75). The branch labels are coloured according to country of origin. b, Detailed core genome characterization of 87 E. coli isolates (n = 75 BARNARDS). Yellow shading represents isolates from other studies16,22 causing neonatal sepsis. The colours on the right represent infant outcome (orange) and onset of sepsis (green), followed by the ST. The numbers and code names (coloured according to study site) of isolates are also given. The branch symbols denote the carriage of carbapenemase ARGs (blaNDM-5 (circles) and blaOXA-181 (squares). NF, not found.

