Fig. 3.
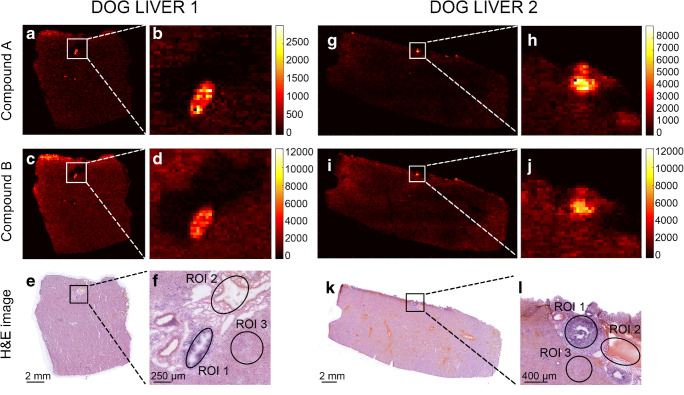
DESI-MRM images obtained from livers of dogs 1 and 2 (dosed with drug candidate B at 65 mg/kg). For dog liver 1, dealkylated metabolite image (a, b) and drug candidate B (c, d). Corresponding H&E images (e, f) show the tissue lesion and define the three selected ROIs. In addition for dog liver 2, dealkylated metabolite image (g, h) and drug candidate B (i, j). Corresponding H&E images (k, l) show the tissue lesion and define the three selected ROIs

