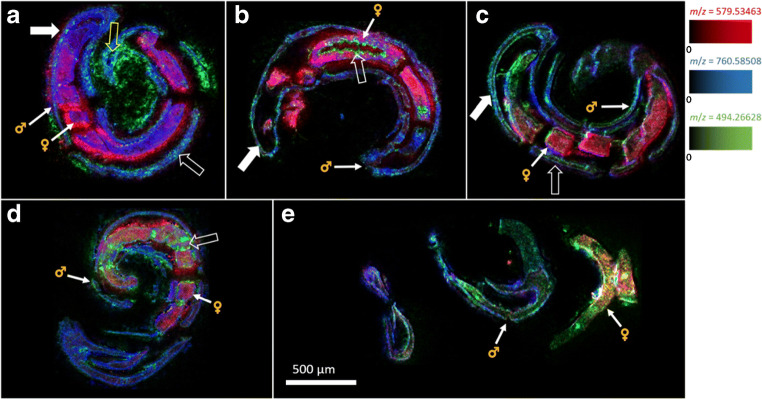
Fig. 6.
MSI images of S. mansoni couples at an imatinib concentration of 20 μmol/L. Depicted analytes were m/z 494.266284 (green, imatinib), m/z 760.585083 (blue, PC(34:1)), and m/z 579.534686 (red, DG(34:0)); incubation times were 20 min (a), 1 h (b), 4 h (c), 12 h (d), and 24 h (e). For each time point, two worm couples were analyzed, of which one representative for each time point is shown here (filled arrows: tegument; unfilled arrows: intestine; unfilled, yellow arrow: esophagus). Measured m/z values and errors: a 494.266554 (+ 0.55 ppm), 760.584979 (− 0.14 ppm), 579.534635 (− 0.09 ppm); b 494.266600 (+ 0.64 ppm), 760.584924 (− 0.02 ppm), 579.534677 (− 0.21 ppm); c 494.266562 (+ 0.56 ppm), 760.584908 (− 0.23 ppm), 579.534785 (+ 0.17 ppm); d 494.266546 (+ 0.53 ppm), 760.584994 (− 0.12 ppm), 579.534639 (− 0.08 ppm); e 494.266481 (+ 0.40 ppm), 760.584981 (− 0.13 ppm), 579.534695 (+ 0.01 ppm)

