Fig. 7.
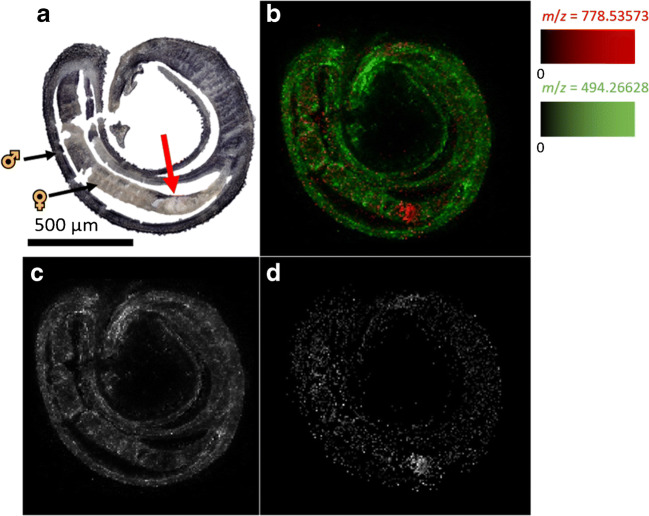
Mapping of imatinib and an ovary-related lipid marker. a Optical image of a tissue section of an S. mansoni couple, 100 μmol/L imatinib, 1 h incubation time, arrow marks the ovary; b MSI image of the S. mansoni couple tissue section, m/z 494.266284 (green, imatinib), m/z 778.535728 (red, PC(34:3)); c MSI image of the S. mansoni couple, m/z 494.266284 (imatinib), corresponding to the green channel in b; d MSI image of the S. mansoni couple, m/z 778.535728 (PC(34:3)), corresponding to the red channel in b. Measured m/z values and errors: 494.265444 (− 1.70 ppm), 778.535266 (− 0.59 ppm), 579.534635 (− 0.09 ppm)

