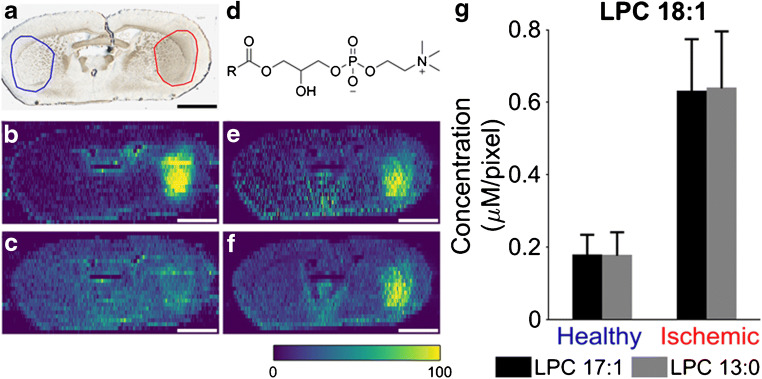
Fig. 1.
Normalization of endogenous LPC to TIC or internal standard. a Optical image of ischemic mouse brain tissue section. On the left with blue circle, the healthy half selection is indicated while the ischemic one is shown on the right with red circle. b TIC-normalized ion image of [LPC 18:1 + Na]+. c TIC-normalized ion image of [LPC 18:1 + K]+. d General structure of an LPC lipid. e Ion image of [LPC 18:1 Na]+ normalized to internal standard [LPC 17:1 + Na]+. f Ion image of [LPC 18:1 + K]+ normalized to internal standard [LPC 17:1 + K]+. g Average detected concentration of [LPC 18:1 + K]+ from healthy and ischemic ROIs normalized to [LPC 17:1 + K]+ (black bars) and [LPC 13:0 + K]+ (gray bars). Scale bars show 2 mm. Color bar scale ranges from 0 to 100% signal intensity. Error bars show standard deviation of pooled means from all replicates

