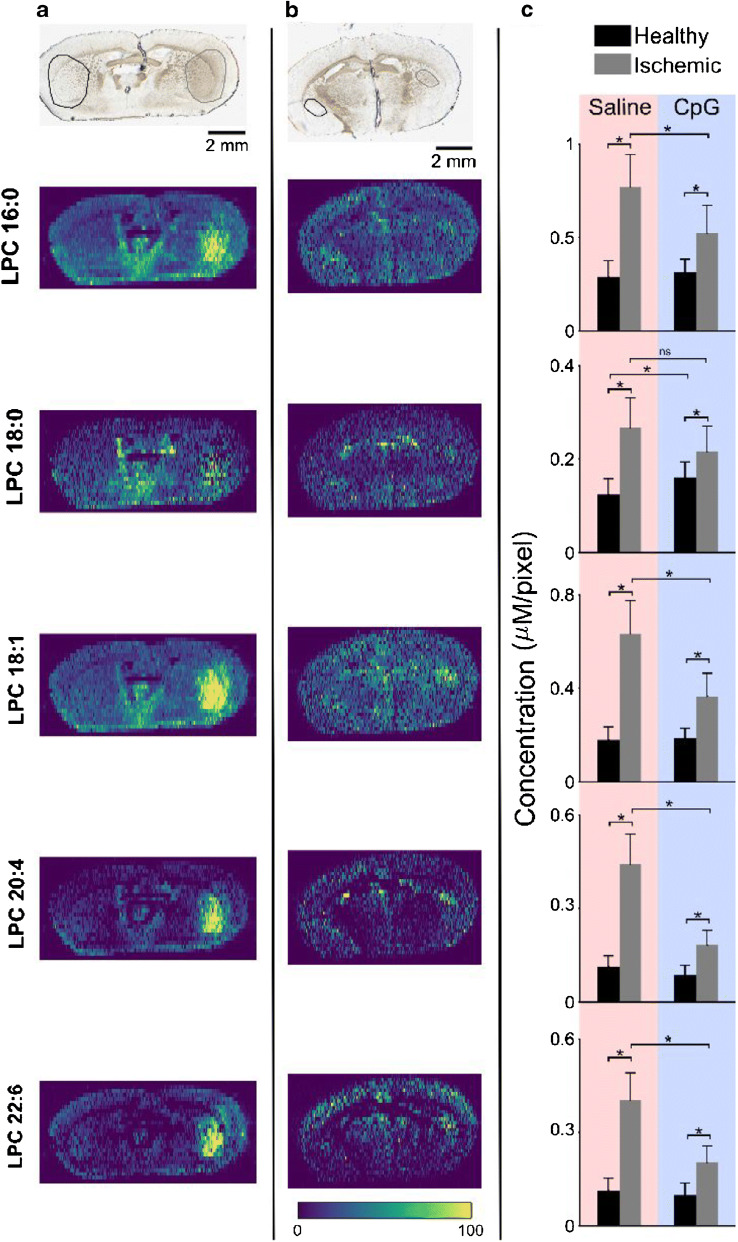
Fig. 3.
LPC alterations in MCAO-treated preconditioned mice. Optical (top) and internal standard normalized ion images of five LPC species in brain tissue section from MCAO-treated mouse preconditioned with a saline and b CpG. ROIs for the healthy and ischemic parts are marked in the optical images with black (left) and gray (right) circles, respectively. c ROI analysis showing average detected concentration of various LPC species for saline- and CpG-treated mice. One-tail t tests were performed to determine statistically significant differences, *p < 0.02; ns, not significant. All data shown depict potassium adducts of endogenous molecules normalized to the potassium adduct of internal standard LPC 17:1. Color bar scale ranges from 0 to 100% signal intensity

