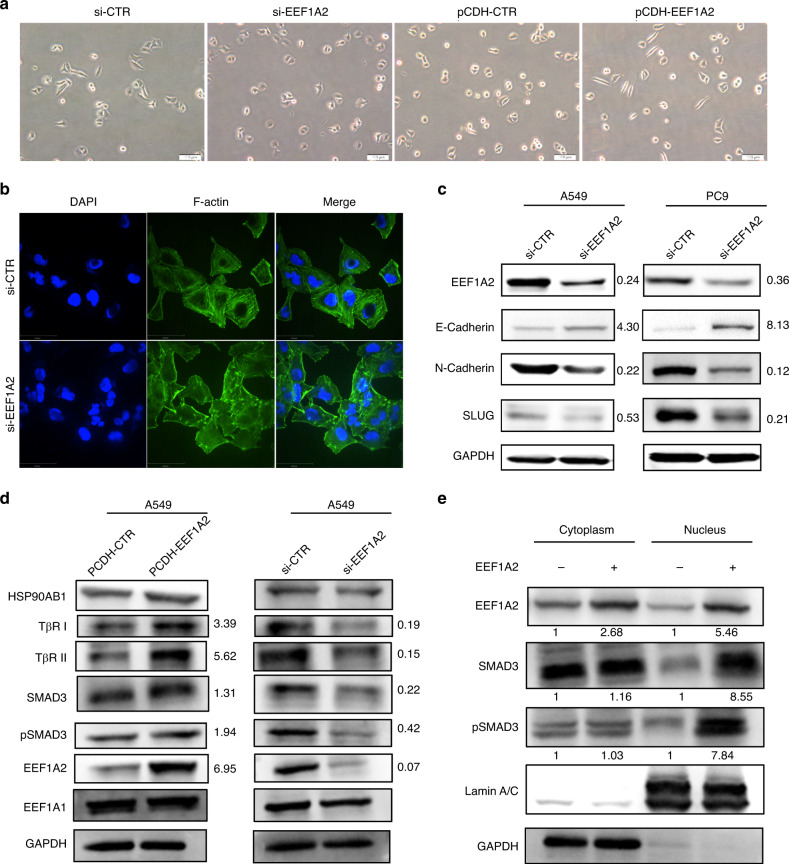
Fig. 4. EEF1A2 induces EMT processes via upregulation of TβRI, TβRII and pSMAD3 nuclear expression.
a Influence of EEF1A2 expression on cell morphology. Images of A549 cells after EEF1A2 silenced or overexpressed. Scale bar = 100 μm. b Immunofluorescence staining of F-actin with phalloidin in A549 cells after EEF1A2 knockdown. Scale bar = 50 µm. c Western blot analysis of EMT marker (E-Cadherin, N-Cadherin and SLUG) protein expression levels in A549 and PC9 cells after EEF1A2 silencing. d Western blot analysis of the TβRI, TβRII, HSP90AB1, EEF1A1, phosphorylation and total SMAD3 protein expression levels in A549 cells with EEF1A2 overexpression or knockdown. e Cytoplasmic and nuclear fractions of A549 cells with or without EEF1A2 overexpression were isolated, and western blot analysis was performed with anti-pSMAD3, total SMAD3, GAPDH and Lamin A/C antibodies.

