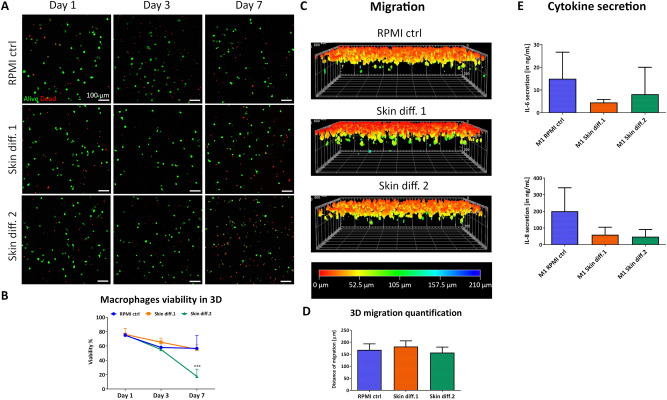
Figure 3.
Influence of culture medium composition on viability, response to pro-inflammatory stimuli and migration ability of macrophages in a 3D environment. (A) Representative maximum intensity projections of macrophages after culture in RPMI control (“RPMI ctrl”), skin differentiation 1 (“Skin diff. 1”) or skin differentiation 2 (“Skin diff. 2”) media, upon live/dead staining. Scale bars: 100 µm. (B) Quantification of macrophage viability. N = 3, n = 2. Error bars represent standard deviation. Statistical significance indicated with ***p < 0.001. (C) Representative 3D reconstructed images of live/dead staining after vertical invasion assay, color coded for invasion depth. (D) Quantification of macrophage maximal migration distance. N = 3, triplicate measurements. Error bars represent standard deviation. (E) Quantification of pro-inflammatory cytokines IL-6 and IL-8 secretion in supernatants. N = 3, duplicate measurements. Error bars represent standard deviation.

