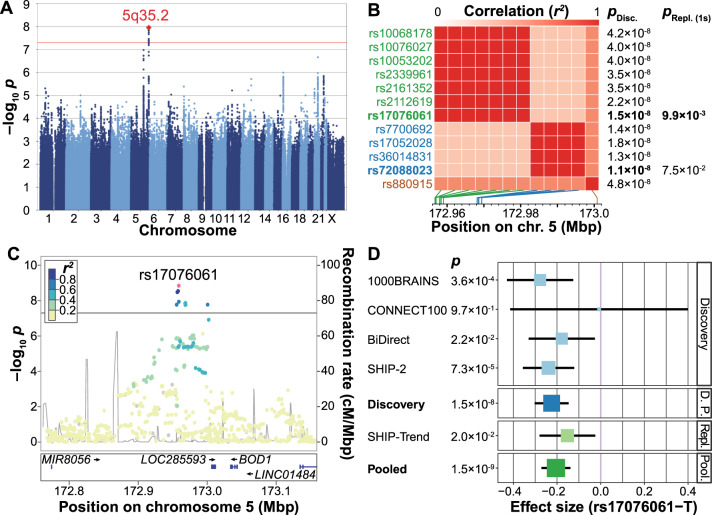
Fig. 2. Presentation of the genome-wide association study (GWAS) results.
A Manhattan plot showing the strength of evidence for an association (p value) in the discovery stage component of the common neurobiological substrate (CCS) GWAS. Each variant is shown as a dot, with alternating shades of blue according to chromosome; the top-associated locus 5q32.2 is labeled with a red diamond. The red line marks the genome-wide significance level. B Matrix of the pairwise linkage disequilibrium (LD) pattern (1000 Genomes population CEU) between the 12 variants that reached genome-wide significance in the discovery GWAS. The two variants rs17076061 and rs72088023 (r2 = 0.267) showed the strongest support for an association in their respective LD blocks and were analyzed in the replication stage. All other variants had pairwise LD > 0.5 with either of these two variants, their association strengths are provided for comparison only. PDisc. discovery stage GWAS p value, pRepl.(1s) one-sided p value in the replication cohort, Mbp mega base pair. C Regional association plot of the top-associated locus after pooled analysis of the discovery stage GWAS and the replication sample. The dot color indicates LD with the lead variant (rs17076061; pink). Gray dots represent signals with missing LD r2 values. cM: centimorgan. D Forest plot of the pooled analysis of the replicated variant rs17076061 in discovery and replication cohorts. D. P.: pooled analysis of discovery stage cohorts, Repl.: replication, Pool.: pooled analysis of the discovery GWAS and the replication cohort SHIP-Trend.

