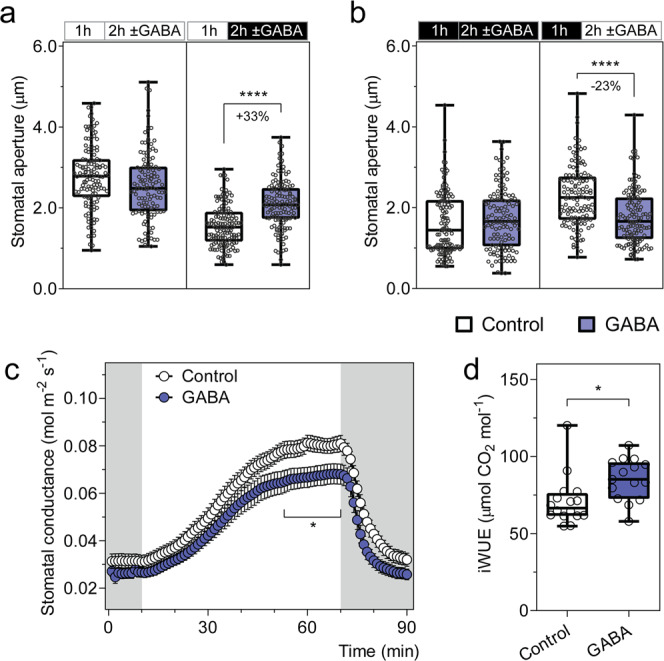
Fig. 2. Exogenous GABA antagonises changes in stomatal pore aperture and increases intrinsic water use efficiency.

a, b Stomatal aperture of wild-type A. thaliana leaves in response to light or dark. Epidermal strips were pre-incubated in stomatal pore measurement buffer for 1 h under light (a) or dark (b), followed by a 2 h incubation under constant light (a), dark (b), light-to-dark transition (a) or dark-to-light transition (b) as indicated in the above graphs by the black (dark) or white (light) bars, together with the application of 2 mM GABA; n = 129 for control (constant light), n = 121 for GABA (constant light), n = 137 for control (light-to-dark transition) and n = 135 for GABA (light-to-dark transition) (a); n = 122 for control (constant dark), n = 124 for GABA (constant dark), n = 123 for control (dark-to-light transition) and n = 130 for GABA (dark-to-light transition) (b); all experiments were repeated twice in steady-state conditions (for both light or dark) or four times for dark-to-light or light-to-dark transitions in different batches of plants using blind treatments with similar results (a, b). GABA feeding of excised leaves reduces stomatal conductance (c) and increases intrinsic water use efficiency (iWUE) (d). c Stomatal conductance of detached leaves from 5- to 6-week-old A. thaliana wild-type plants was recorded using a LI-COR LI-6400XT in response to dark (shaded region) and 200 µmol m−2 s−1 light (white region), fed with artificial xylem sap solutions ± 4 mM GABA. d iWUE efficiency of detached leaves was calculated as the ratio of photosynthetic rate (Supplementary Fig. 2b) versus stomatal conductance (c); n = 16 independent leaves for control and n = 15 independent leaves for GABA, data collected from three different batches of plants (c, d). All data are plotted with box and whiskers plots: whiskers plot represents minimum and maximum values, and box plot represents second quartile, median and third quartile (a, b, d), or data are represented as mean ± s.e.m (c); statistical difference was determined by two-way ANOVA (a, b), or two-sided Student’s t test (c, d), *P < 0.05 and ****P < 0.0001.
