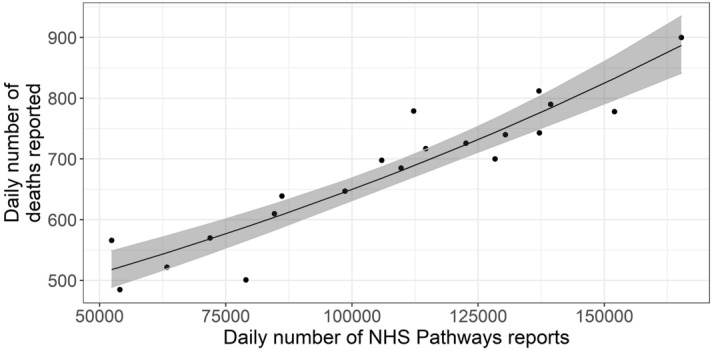
Figure 4.

Daily total COVID-19 deaths reported in England between 3rd and 22nd April 2020, against the number of potential COVID-19 cases reported through NHS Pathways with a lag of 16 days (between 18th March and 6th April 2020). The black line and grey ribbon correspond to predictions from the regression model and associated 95% confidence intervals. The coefficient of determination indicates that 85.8% of the deviance in reported deaths is linearly explained by NHS Pathways reports.
