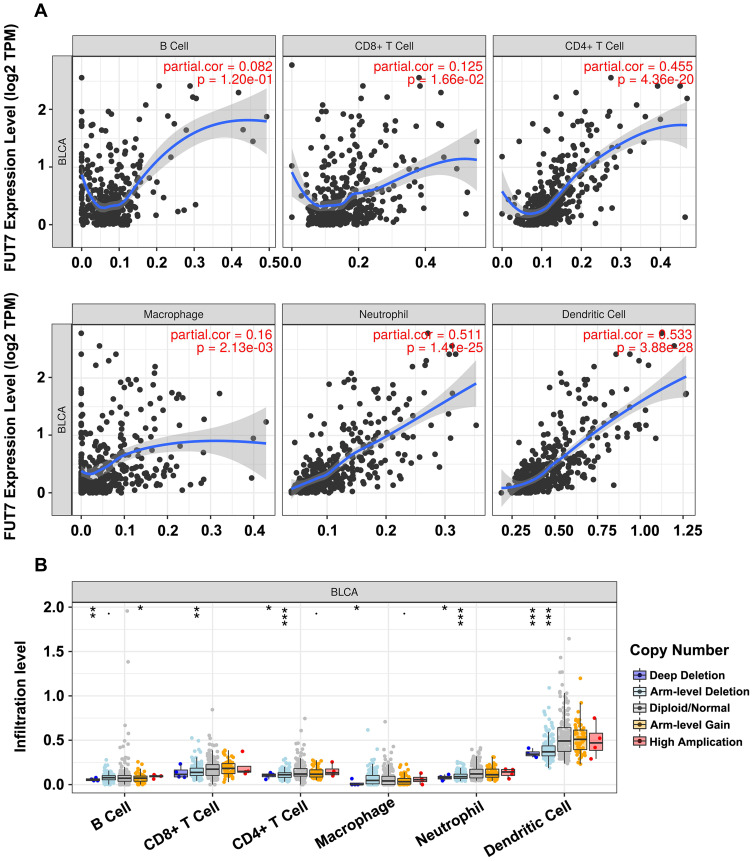
Figure 4.
Correlations between the expression of FUT7 and immune cell infiltration levels. (A) The correlations between FUT7 expression and infiltrating levels of immune cells, including B cells (p=1.20e-01), CD8+ T cells (p=1.66e-02), CD4+ T cells (p=4.36e-20), macrophage (p=2.13e-03), neutrophil (p=1.41e-25), and dendritic cell (p=3.88e-28). (B) The comparison of tumor infiltrating levels in BLCA with different somatic copy number alterations for FUT7 from TIMER database. *P<0.05, **P<0.01, ***P<0.001.

