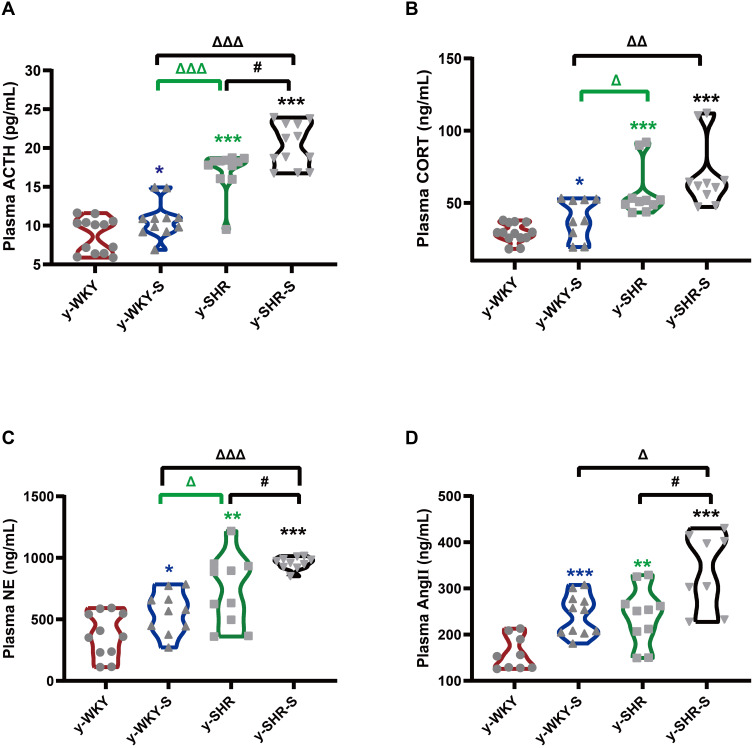
Figure 2.
Stress-related changes in hormone levels in the plasm. (A–D) The concentrations of ACTH, CORT, NE and Ang II was notable enhancement in the stress-condition than its control group, respectively. *p < 0.05, **p < 0.01, ***p < 0.001 (Black y-SHR-S vs y-WKY, Blue y-WKY-S vs y-WKY, Green y-SHR vs y-WKY); #p < 0.05 (y-SHR-S vs y-SHR); Δp < 0.05, ΔΔp < 0.01, ΔΔΔp < 0.001 (Black y-SHR-S vs y-WKY-S, Green y-SHR vs y-WKY-S).

