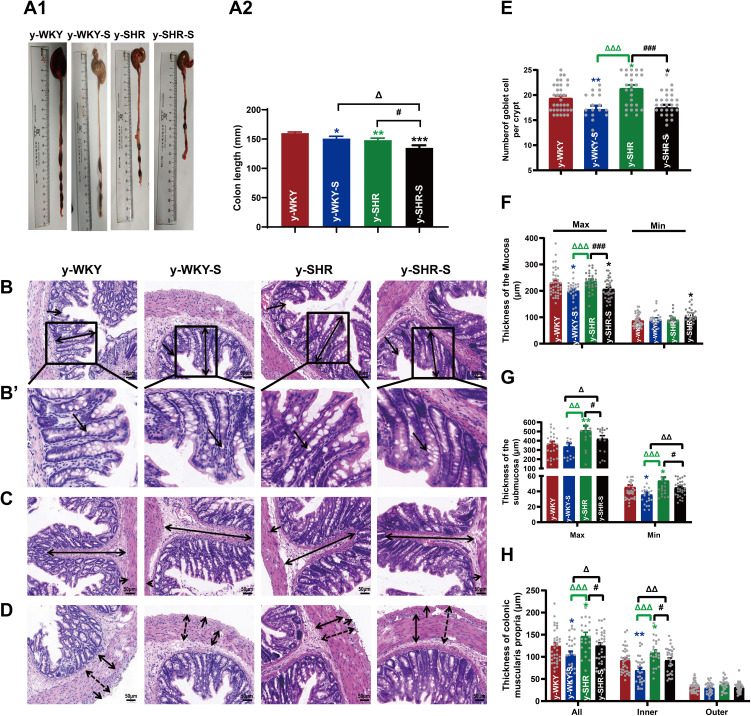
Figure 4.
Alteration of histopathological structure in the colon of younger restraint stress hypertensive rats from the y-WKY and y-SHR groups. (A1 and A2) Colon was measured the length with a ruler to quantify the effect of restraint stress in different groups. (B–D) Cross-sections of the distal colon were observed at 200× magnification using a light microscope. The length of the mucosa layer and muscle thickness in each tissue were measured using Leica Application Suite. (B and F) were stained with hematoxylin-eosin (HE) to measure the thickness of mucosa layer (Max: double arrows; Min: single arrows), Obtain B’ by zooming in part of B (black frame). (B’and E) The number of goblet cells (arrow) in each intact crypt was decreased in different groups. (C and G) The thickness of submucosa layer (Max: double arrows; Min: single arrows). (D and H) The thickness of muscularis propria layer (All: dotted double arrows; Inner: double arrows; Outer single arrows). Data are mean ± SEM. Unpaired t-test (n = 5–8 per group, choose 8 fields per rat) Scale bar: 50 μm. *p < 0.05, **p < 0.01, ***p < 0.001 (Black y-SHR-S vs y-WKY, Blue y-WKY-S vs y-WKY, Green y-SHR vs y-WKY); #p < 0.05, ###p < 0.001 (y-SHR-S vs y-SHR); Δp < 0.05, ΔΔp < 0.01, ΔΔΔp < 0.001 (Black y-SHR-S vs y-WKY-S, Green y-SHR vs y-WKY-S).

