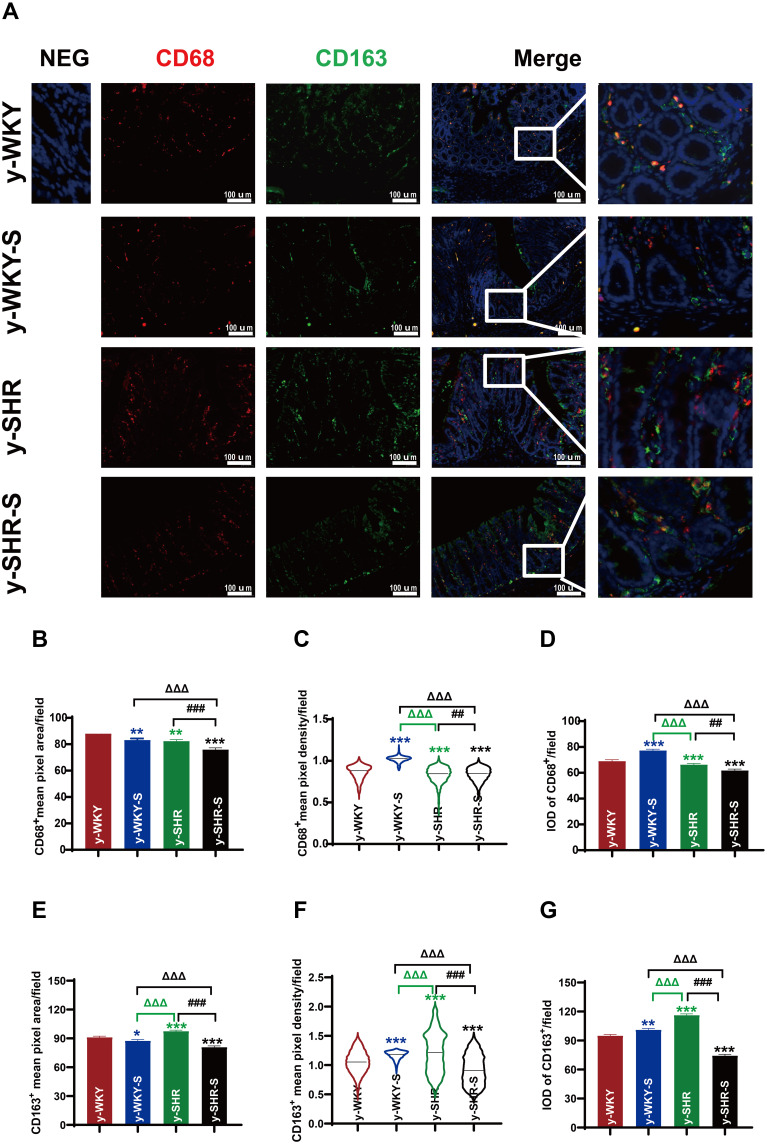
Figure 11.
Accumulation of macrophages in colon tissues of stressed rat. (A) Immunofluorescence staining for the accumulation of M1Mφ and M2Mφ in colon tissue after 1 week of restraint pressure. The white box is a further enlargement of the partial picture, bar =100 µm. (B–G) Quantitative analysis of M1 and M2-positive cells relative to total nuclear number (IOD=area × density). Data are expressed as mean ± SEM. n = 5 rats expressing the number rats in each group. *p < 0.05, **p < 0.01, ***p < 0.001 (Black y-SHR-S vs y-WKY, Blue y-WKY-S vs y-WKY, Green y-SHR vs y-WKY); ##p < 0.01, ###p < 0.001 (y-SHR-S vs y-SHR); ΔΔΔp < 0.001 (Black y-SHR-S vs y-WKY-S, Green y-SHR vs y-WKY-S).

