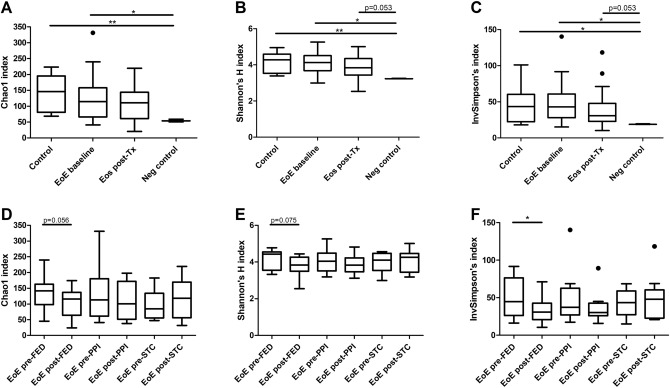
Figure 1.
Comparison of oesophagus microbiota alpha-diversity across groups. Tukey plots showing alpha-diversity for Chao1 (A and D), Shannon’s H (B and E) and inverse Simpson’s (C and F) indices. Comparison of control subjects, baseline and post-treatment EoE patients, and negative controls for each of the indices analyzed (A–C). Comparison of paired pre- and post-treatment samples divided by treatment for each of the indices analyzed (D-F). *p < 0.05, **p < 0.01. EoE: eosinophilic oesophagitis; EoE post-Tx: EoE patients after treatment; Neg control: negative controls for 16S amplification; FED: food elimination diet; PPI: proton pump inhibitors; STC: swallowed topical corticosteroids.

