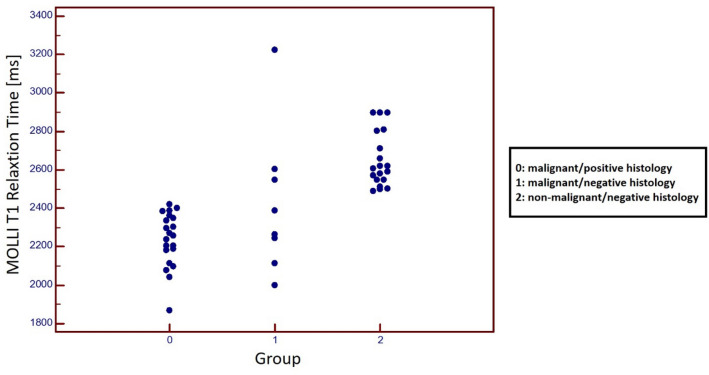
Figure 3.
Graphs with individual plotted values show distribution of MOLLI T1 relaxation time in effusions from patients with known malignancy and positive histology/cytology (Group 0), effusions from patients with known malignancy but negative histology/cytology (Group 1) and effusions from patients without a known malignancy and negative histology/cytology (Group 2). Individual values are represented as single colored dots. One-way ANOVA for intergroup comparison showed T1 relaxation times differed between all groups (Group 0: 2237.1 ± 136.9 ms; Group 1: 2423.3 ± 357.4 ms; Group 2: 2650.5 ± 138.5 ms) (p < 0.001; post hoc test for all intergroup comparisons: < 0.05).

