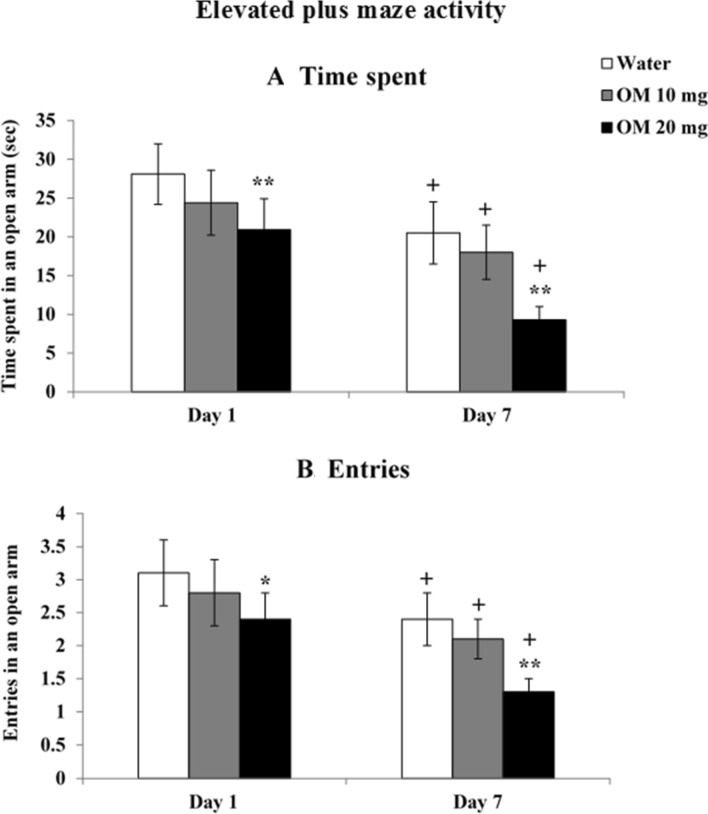
Fig. 3.
Dose-related effects of OM on a time spent and b number of entries in open arm. Values are means ± SD (n = 8). Significant differences using Tukey’s test: *p < 0.05, **p < 0.01 from respective day values of water treated group and +p < 0.01 from day 1 values of similar treated group, following 2-way ANOVA (RMD)

