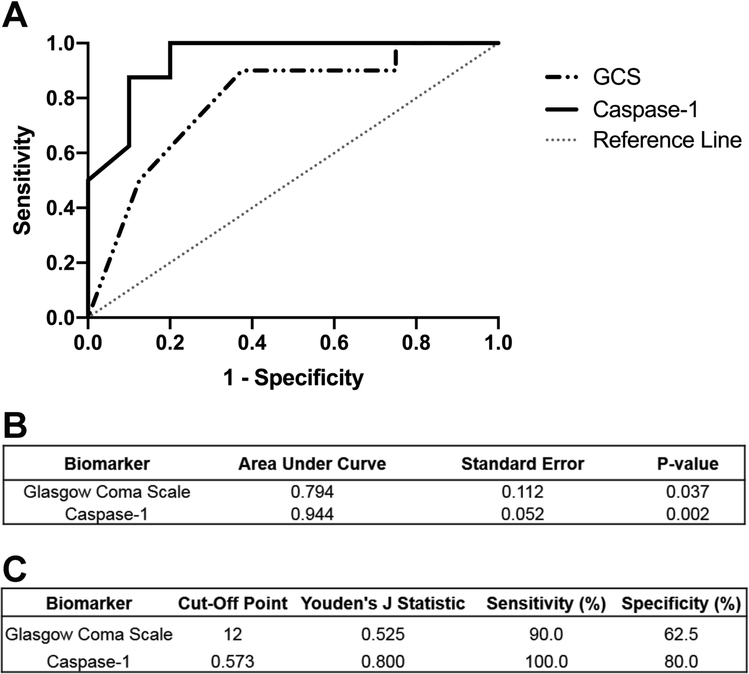
Figure 2.
Receiver operating characteristic (ROC) curve of caspase-1 for the prediction of poor outcome. A) ROC curves were generated from caspase-1 levels in subarachnoid hemorrhage (SAH) patients (n=18, solid black line). ROC curve for GCS ability to predict outcome was plotted as well (dashed gray line). B) Caspase-1 had a better predictive ability (Area Under Curve (AUC) = 0.944) than did GCS (AUC = 0.794). C) Youden’s J Statistic yielded a cutoff value for capase-1 activity levels that would be indicative of poor outcome at discharge.

