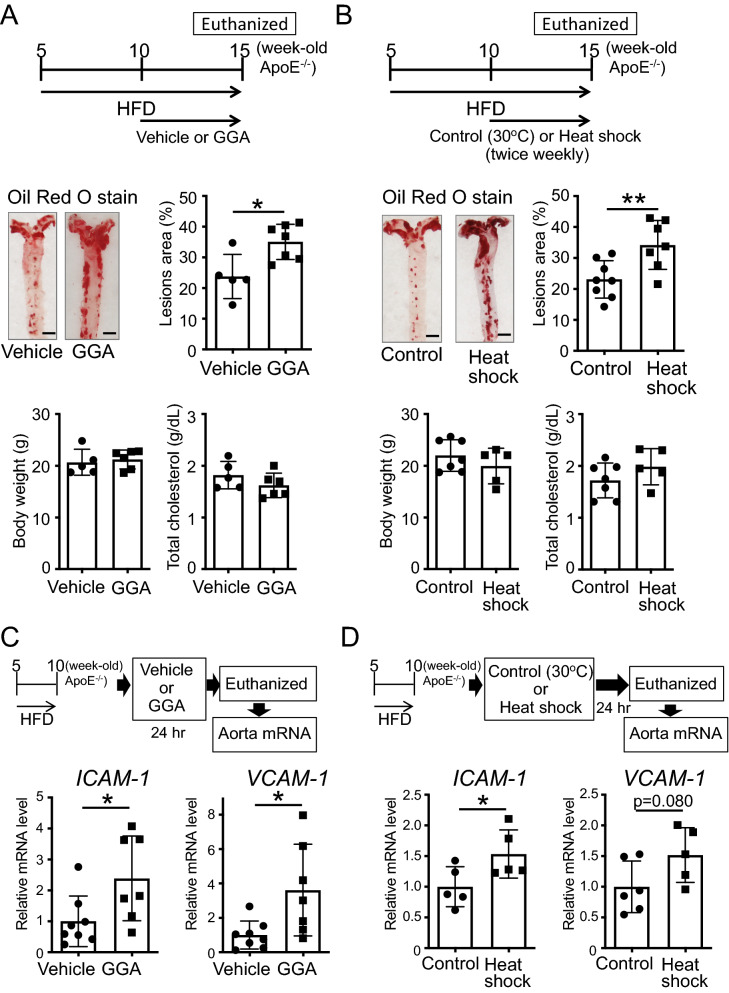
Figure 4.
Effect of the induction of heat shock proteins (HSPs) on the progression of atherosclerosis. (A) 10-week-old ApoE−/− mice, evidencing the formation of atheromas, were administered geranylgeranylacetone (GGA; 500 mg/kg/day) for 5 weeks. Images of the Oil Red O staining of the aorta of ApoE−/− mice are shown. Bar graphs quantifying the atherosclerotic areas, body weight, and total cholesterol levels are also shown. (B) 10-week-old ApoE−/− mice, after the formation of atheromas, were treated in a 30 °C (control) or 41 °C (heat shock) warm bath for 30 min, twice weekly, for 5 weeks. Images of the Oil Red O staining of the aorta of ApoE−/− mice are shown. Bar graphs quantifying the atherosclerotic areas, body weight, and total cholesterol levels are also shown. (C) Intercellular adhesion molecule 1 (ICAM-1) and vascular cell adhesion molecule 1 (VCAM-1) mRNA expression levels in the aorta after GGA administration. 10-week-old ApoE−/− mice, after the formation of atheromas, were administered vehicle or GGA (500 mg/kg/day) for 24 h. Then, total RNA was extracted from the aorta. (D) ICAM-1 and VCAM-1 mRNA expression levels in the aorta after heat shock treatment. 10-week-old ApoE−/− mice, showing signs of the formation of atheromas, were treated in a 30 °C (control) or 41 °C (heat shock) warm bath for 30 min. After 24 h, total RNA was extracted from the aorta. Each bar represents the mean ± standard deviation (SD). Significant differences are marked on the chart (*p < 0.05; **p < 0.01). n = 5–8 mice per group. Scale bar = 2 mm.

