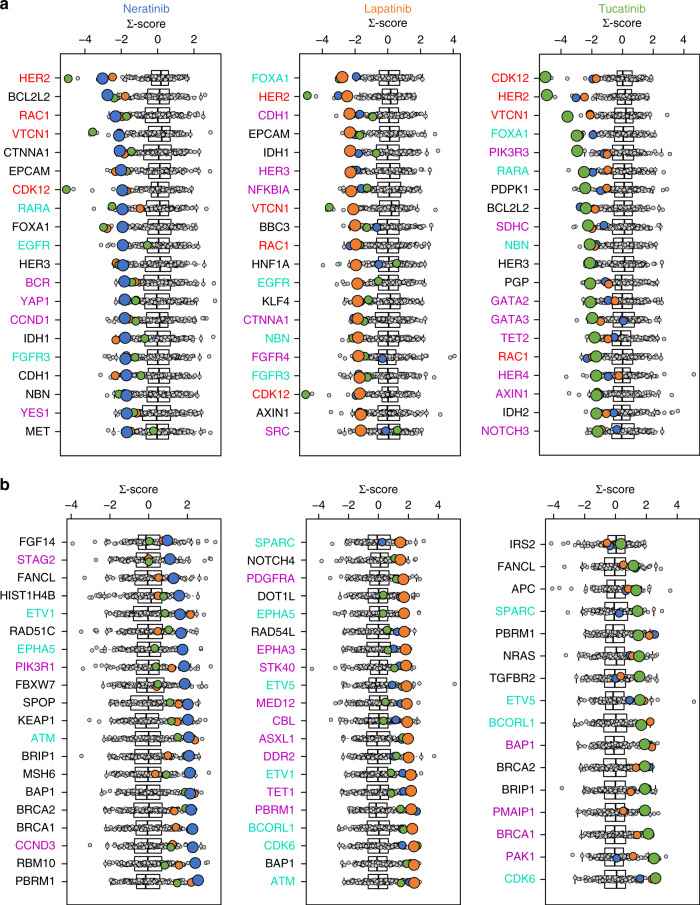
Fig. 5. Gene expression-based biomarker analysis.
Pearson correlation analysis of cell line response to Neratinib, Lapatinib, and Tucatinib with gene expression levels in 99 of 115 cancer cell lines. Correlations for each respective drug (Neratinib—blue dots, Lapatinib—orange dots, tucatinib—green dot) were compared to 168 reference compounds (grey dots). These correlations were normalised to a Σ-score. A negative score indicates a higher gene expression correlates to sensitivity to the drug. A positive score represents high gene expression correlates to insensitivity. The top 20 clinically actionable genes significantly associated with a sensitivity and b resistance are shown. Correlations of the CCLE microarray gene expression data set were validated using CCLE RNAseq, COSMIC, and Genentech mRNA expression databases. Non-black genes are considered validated, i.e. significantly correlated in at least two out of three additional gene expression data sets. In addition, genes in red and light green are validated for three out of three and two out of three HER2 TKIs, respectively. Genes in purple are validated only for the corresponding compound.

