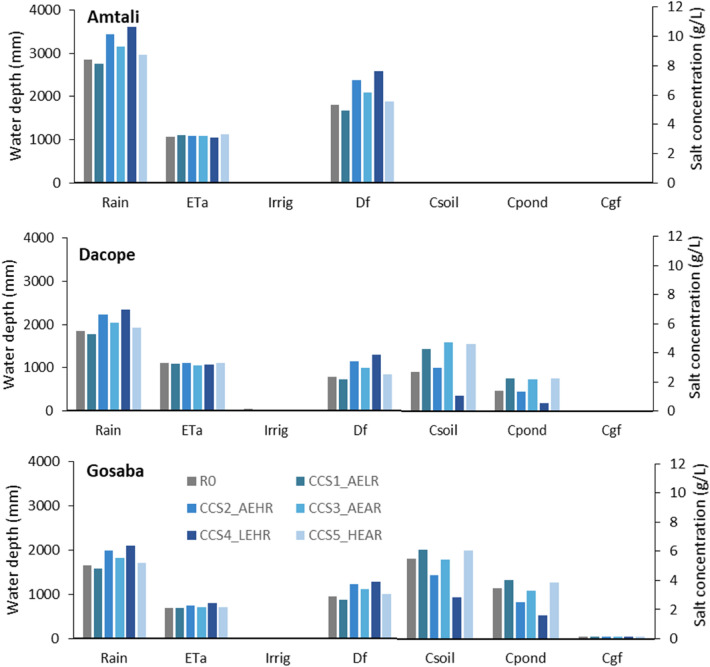
Figure 5.
Comparison of water and salt balance for the base case rice-fallow management and for 5 climate scenarios for Amtali (top), Dacope (middle) and Gosaba (bottom), (base case scenarios i and scenarios vii to xi). Each group of columns shows the average annual water depth (left axis) and salt concentration (right axis). The average annual water depths are rain, actual evapotranspiration (ETa), applied irrigation (Irrig), and surface drainage from the fields which is equivalent to runoff from the soil to the canals and ponds (Df). The salt concentrations are concentration in the soil water (Csoil), in the pond water (Cpond) and in the fresh shallow groundwater (Cgf).

