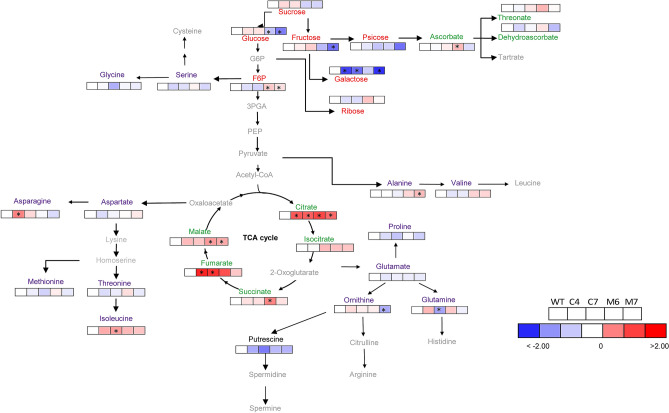
Figure 7.
Representative metabolites pathway changes in HXK3 transgenic lines of Arabidopsis thaliana plant growing under optimal condition. Amino acids, organic acids, sugars, and sugar alcohols were determined by GC/MS as described in M&M section. The full data sets from these metabolic profiling studies are additionally available in Supplementary Table S2. Data is normalized with its respective wild-type (Columbia-0) (to allow statistical assessment, individual plants from this set were normalized in the same way). The color code of the heat map is given at the log2 following the scale above the diagram. Different colors represent levels of metabolite fold change where red is increasing and blue is decreasing. Values are presented as means ± SE (n = 5). Asterisks indicate that the values from transgenic lines were determined by Student’s t test to be significantly different (P < 0.05) from the wild type.

