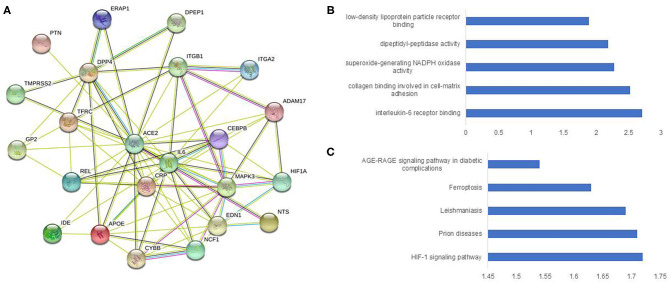
Figure 1.
Construction and analysis of a protein-protein interaction network of ACE2 and immune genes. The protein-protein interaction network was visualized by STRING. The color saturation of the edges represents the confidence score of a functional association. (A) Intricate protein-protein interaction network (number of nodes 23, number of edges 80, average node degree 6.96, PPI enrichment p-value < 1.0e-16, average local clustering co-efficient 0.777). (B) Enrichment analysis by molecular function. (C) Enrichment analysis by KEGG.

