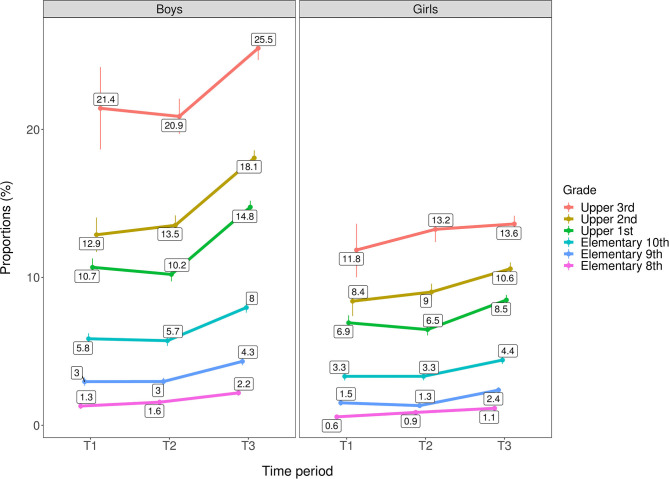
Figure 1.
Trends in any past year cannabis use by age group/grade across genders (n = 566,912). T1 = 2010–2013. T2 = 2014–2016. T3 = 2017–2019. Rates are adjusted for geographical location and municipality population. Individuals with missing data on municipality population (n = 1,604) are excluded from the analysis.

