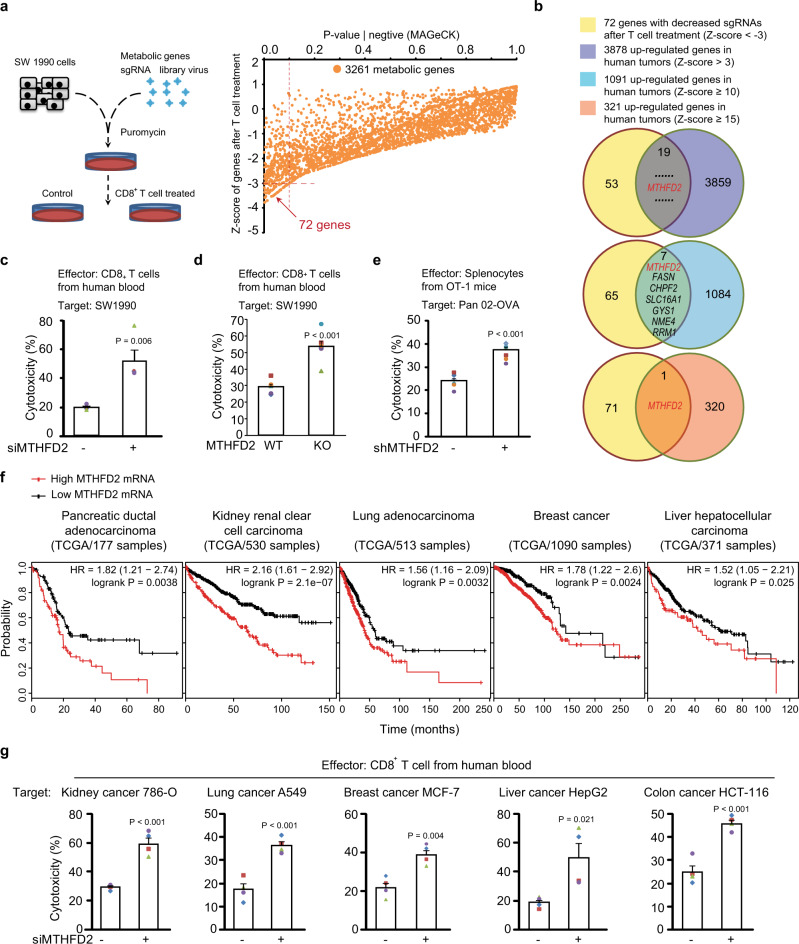
Fig. 1. Folate cycle enzymes contribute to tumor resistance against cytotoxic T cells.
a Left: a cartoon showing the process of the CRISPR/Cas9 sgRNA library-based functional screen of metabolic genes that save SW1990 cells from human CD8+ effector T cells; right: The Z-scores analysis of the residual sgRNA after functional screen by MAGeCK (also see Supplementary Data 1). b The indication of the combined analysis of the functional screen with previous meta-analysis of tumor overexpressed genes (also see Supplementary Data 1 and 2). c–d SW1990 cells transfected with control or MTHFD2 siRNAs (c) (n = 4 independent experiments) or sgRNAs (d) (n = 6 independent experiments) and incubated with activated human CD8+ effector T cells for 16 h, the cytotoxicity was measured by lactate dehydrogenase (LDH) release assay. e OVA-Pan02 cells transfected with indicated shRNAs and incubated with activated splenocytes from OT-1 mice for 16 h, the cytotoxicity was measured by LDH release assay (n = 7 independent experiments). f Kaplan–Meier analysis of overall survival for Pancreatic ductal adenocarcinoma, Kidney renal clear cell carcinoma, Lung adenocarcinoma, Breast cancer, Liver hepatocellular carcinoma patients with low versus high expression of MTHFD2 (Kaplan–Meier analysis with the log-rank test showing in the figure from 177, 530, 513, 1090, 371 samples in the TCGA datasets.). g Indicated cancer cells transfected with indicated siRNAs and incubated with activated human CD8+ effector T cells for 16 h, the cytotoxicity was measured by LDH release assay (n = 4 independent experiments). In (c–e) and (g), the values are presented as mean ± s.e.m.; p values (Student’s t test, two-sided) with control or the indicated groups are presented (also see Supplementary Fig. 1).

