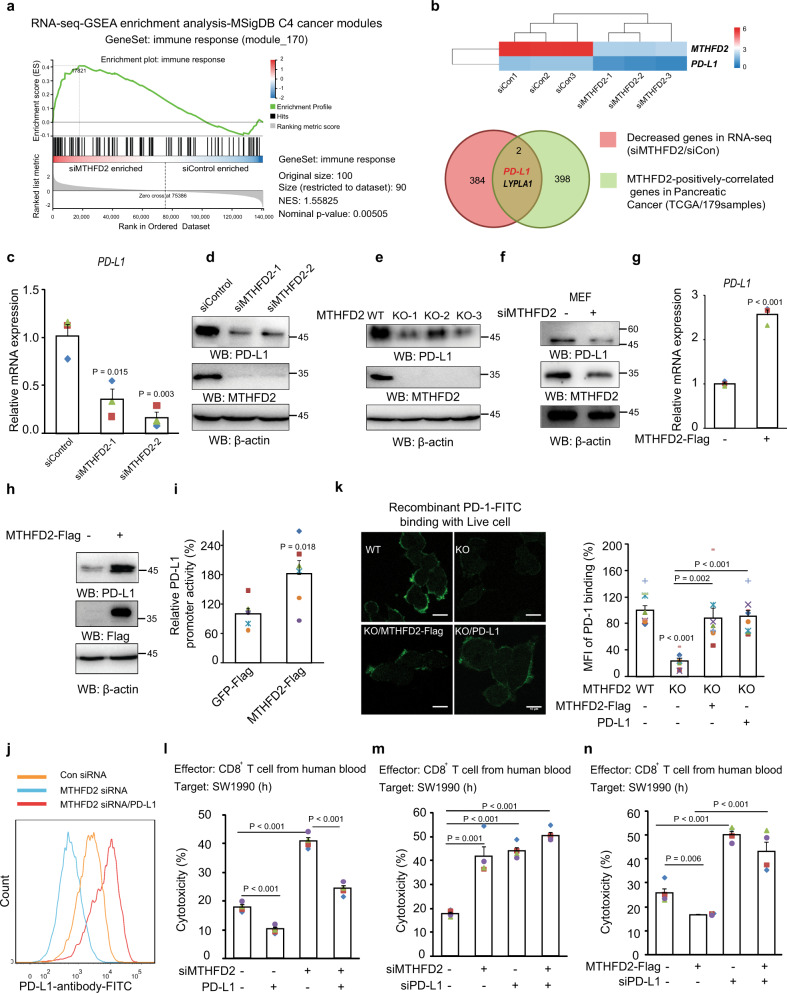
Fig. 2. MTHFD2 promotes tumor immune evasion via upregulating PD-L1 expression.
a The GSEA analysis of the transcriptome (RNA-seq) in SW1990 cells transfected with indicated siRNA, were performed in MSigDB C4 (cancer modules) database with the GeneSet of “immune response (module 170)”. b The combined analysis of the genes is positively correlated with MTHFD2 mRNA both in the RNA-seq data (also see Supplementary Data 3) and in Pancreatic cancer clinical samples from the TCGA database (also see Supplementary Data 4). c–d SW1990 cells transfected with indicated siRNAs for 48 h, PD-L1 mRNA levels were analyzed by real-time PCR (c) (n = 3 independent experiments) and immunoblotting analyses were performed using the indicated antibodies (d). e SW1990 cells stably transduced with indicated sgRNAs by lentivirus, immunoblotting analyses were performed using the indicated antibodies. f MEF cells transfected with indicated siRNAs for 48 h, and immunoblotting analyses were performed using the indicated antibodies. g–i SW1990 cells transfected with indicated expressing vectors, PD-L1 mRNA levels were analyzed by real-time PCR (g) (n = 3 independent experiments); immunoblotting analyses were performed using the indicated antibodies (h); and the transcriptional activity of PD-L1 promoter (from-2000 bp to 0 bp) is examined by a luciferase-based reporter assay (i) (n = 6 independent experiments). j The cell-membrane localized PD-L1 in SW1990 cells with indicated treatment were analyzed by Flow cytometry using PD-L1 antibody (also see Supplementary Fig. 7a). k WT or MTHFD2-KO SW1990 cells transfected with indicated expressing vectors, were incubated with purified FITC-labled-recombinant-PD-1-extracellular-domain for 15 min and the cell surface localized PD-1-FITC were detected by confocal microscopy (left), scale bars: 10 μm; the FITC signal normalized to cell number were quantified (n = 8 independent experiments). l–n SW1990 cells transfected with indicated siRNAs and expressing vectors, were incubated with activated human CD8+ effector T cells for 16 h and the cytotoxicity was measured by LDH release assay (n = 4 independent experiments). In (c, g, i, and k–n), the values are presented as mean ± s.e.m.; p values (Student’s t test, two-sided) with control or the indicated groups are presented (also see Supplementary Fig. 2).

