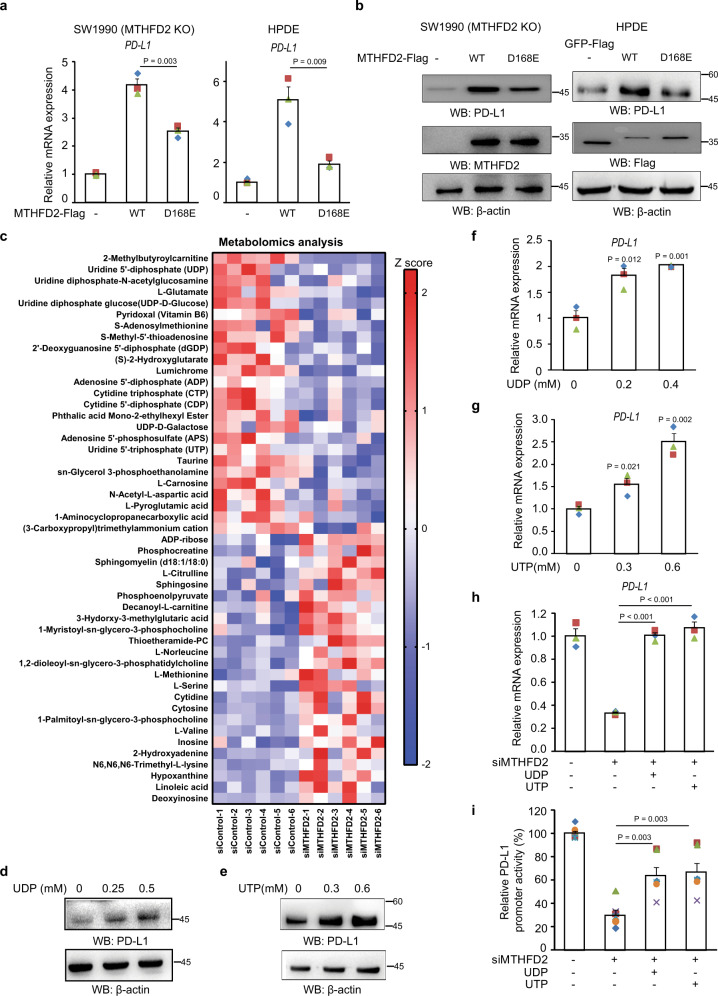
Fig. 4. Metabolic function of MTHFD2 promotes protein PD-L1 transcription through uridine-related-metabolites.
a–b, MTHFD2-KO SW1990 cells and HPDE cells transfected with indicated expressing vectors, PD-L1 mRNA levels were analyzed by real-time PCR (a) and immunoblotting analyses were performed using the indicated antibodies (b). c The metabolomics analysis in SW1990 cells with siMTHFD2 (n = 6 independent samples). d–g SW1990 cells were treated with indicated concentration of indicated metabolites for 24 h, immunoblotting analyses were performed using the indicated antibodies (d, e) and PD-L1 mRNA levels were analyzed by real-time PCR (f, g). h, i SW1990 cells with siMTHFD2 were treated with 0.3 mM UDP or 0.6 mM UTP for 24 h, PD-L1 mRNA levels were analyzed by real-time PCR (h) and the transcriptional activity of PD-L1 promoter (from 2000 bp to 0 bp) is examined by a luciferase-based reporter assay (i). In (a) and (f–i), the values are presented as mean ± s.e.m (n = 3 independent experiments); p values (Student’s t test, two-sided) with control or the indicated groups are presented (also see Supplementary Fig. 4).

