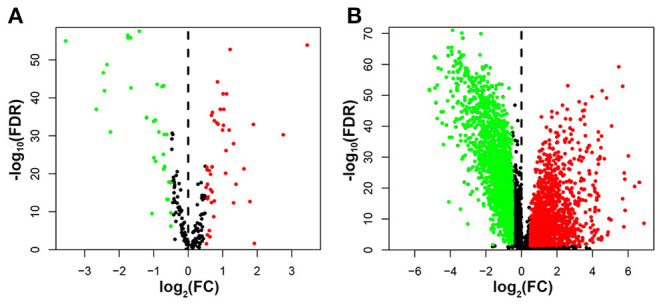
Figure 2.

The volcano plot showed differential expression of autophagy-related genes and lncRNAs in breast cancer tissues and adjacent tissues. Red represented significantly up-regulated lncRNAs and autophagy genes, green showed significantly down-regulated ones, and black indicated no different ones. (A) The volcano plot demonstrating the differentially expressed autophagy-related genes. (B) The volcano plot demonstrating the differentially expressed lncRNAs.
