Figure 7.
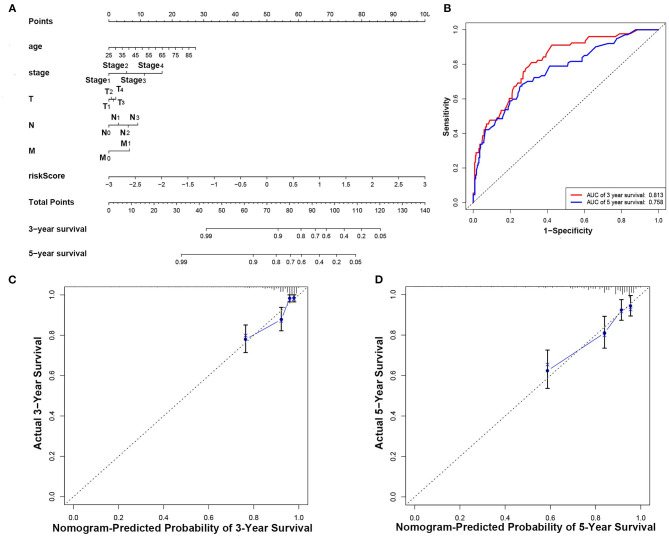
Construction and evaluation of the nomogram. (A) Nomogram for predicting the 3- and 5-year survival rates of patients with breast cancer. (B) ROC curve analysis demonstrated that AUCs for 3- and 5-year OS predicted by the nomogram were 0.813 and 0.785, respectively. (C) Calibration chart based on 3-year OS of the nomogram. (D) Calibration chart based on 5-year OS of the nomogram.

