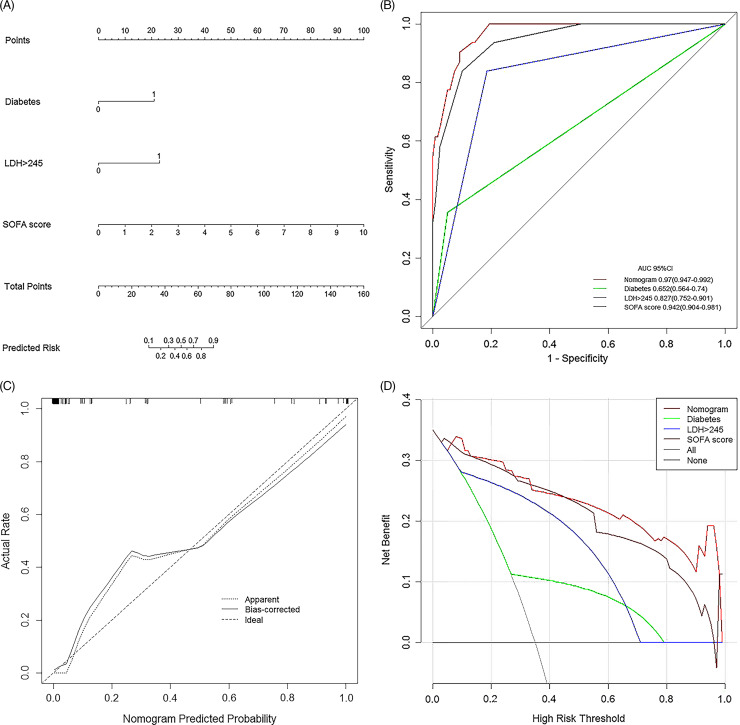
Figure 3.
Prediction of in-hospital death of patients with COVID-19. A, Prognostic nomogram for predicting in-hospital death risk of patients with COVID-19. Prognostic patient’s value is located on each variable axis, and a line is drawn upward to determine the number of point nomogram for predicting in-hospital death risk of patients with COVID-2019. B, Area under the receiver operating characteristic curve (AUC) of SOFA score, diabetes, LDH, and the nomogram were 0.942, 0.827, 0.652, and 0.970, respectively. Calibration curve (C) and clinical impact curve of the nomogram (D), in which the predicted probability of in-hospital death was highly consistent with the actual observation and had good net benefit.

