FIGURE 4.
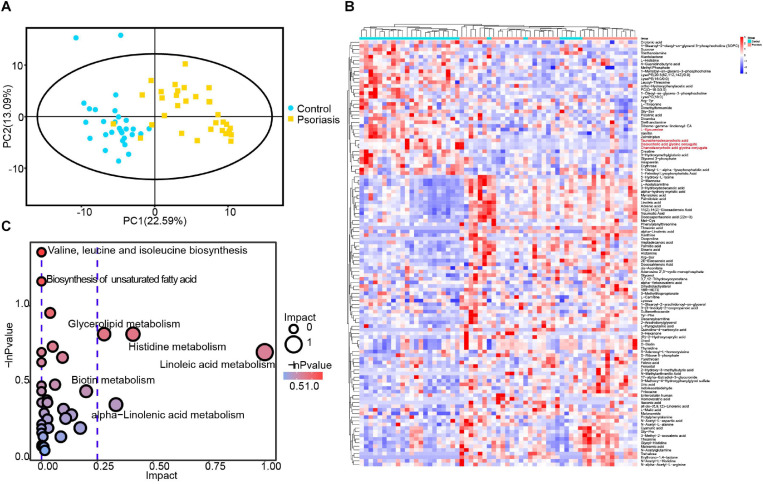
Plasma metabolomic profiling. (A) PCA revealed clear separation of the plasma metabolome between psoriasis patients and healthy controls. (B) Heatmap showing the significantly changed metabolites in psoriasis patients compared with healthy controls. The metabolites labeled with red font are microbiota-specific metabolites. (C) Bubble plot of the metabolic pathway enrichment analysis results.

