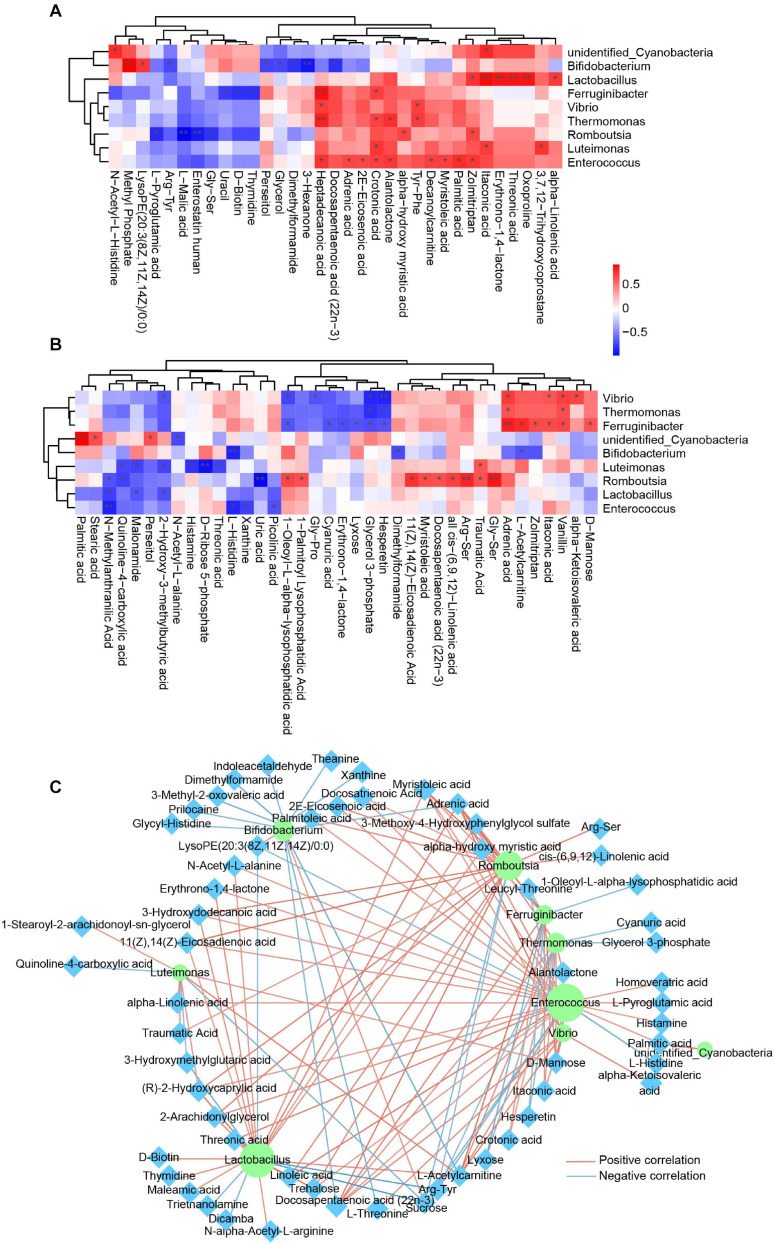
FIGURE 5.
Integrated analysis of skin microbes and plasma metabolites. (A) Spearman correlation analysis between significantly altered skin microbes and significantly changed plasma metabolites in the healthy control group. Red, positive correlation; blue, negative correlation. *p < 0.05. (B) Spearman correlation analysis between significantly altered skin microbes and significantly changed plasma metabolites in the psoriasis group. Red, positive correlation; blue, negative correlation. *p < 0.05. (C) Spearman correlation network between significantly altered skin microbes and significantly changed plasma metabolites in all samples from both groups. The purple circle represents the skin microbiota, and the cyan diamond represents plasma metabolites. Red line, positive correlation; blue line, negative correlation. Only the correlations with p < 0.05 are shown. **p < 0.01.

