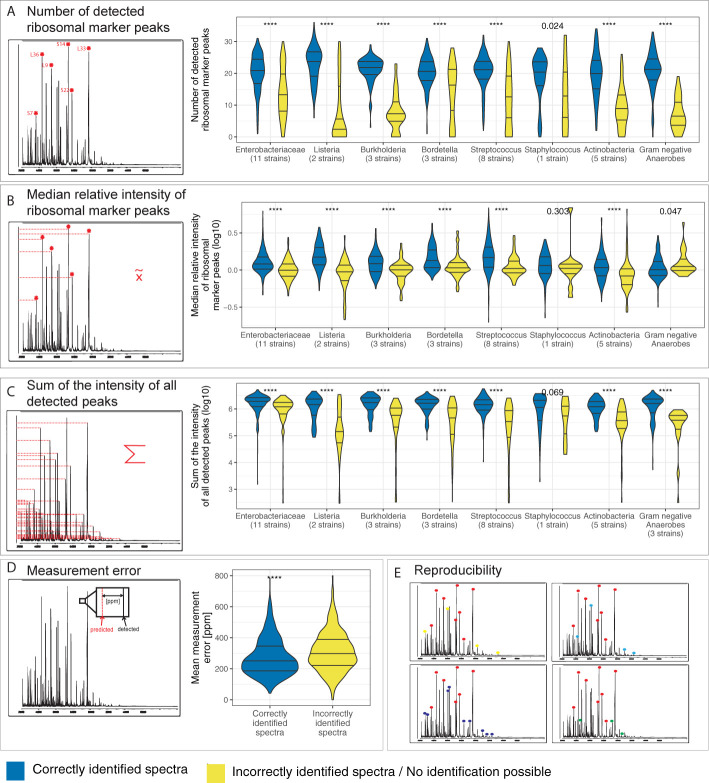
Figure 1.
Spectra features compared between correctly and incorrectly identified spectra per phylogenetic group. Species identification was performed by the MALDI Biotyper database and spectra were acquired on a microflex Biotyper. (A) the number of detected ribosomal marker peaks, (B) the median relative intensity of these, (C) the sum of intensity of all detected peaks, (D) measurement error and (E) reproducibility i.e. number of peaks detected in three out of four technical replicates divided by the total number of peaks in a spectrum. ****p-value < 0.0001.

