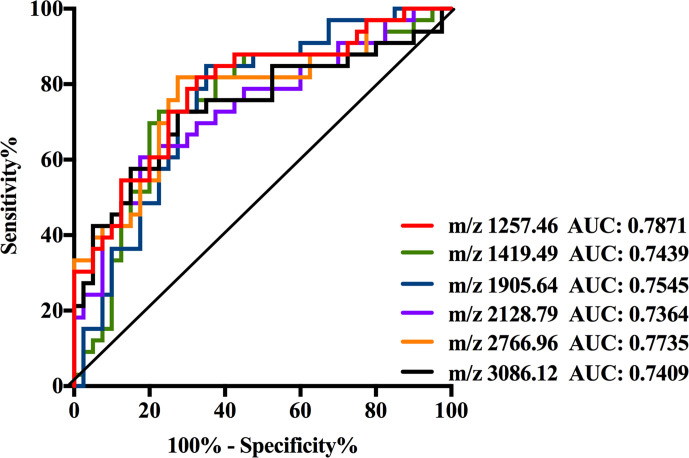
Figure 4.
Receiver operating characteristic (ROC) curve analyses for the six significantly changed individual N-glycan. The ROC was employed to evaluate the discrimination efficiency of these N-glycans including: m/z1257.46, 1419.49, 1905.64, 2128.79, 2766.96, and 3086.12. Their AUC values were 0.7871, 0.7439, 0.7545, 0.7364, 0.7735, and 0.7409 respectively.

