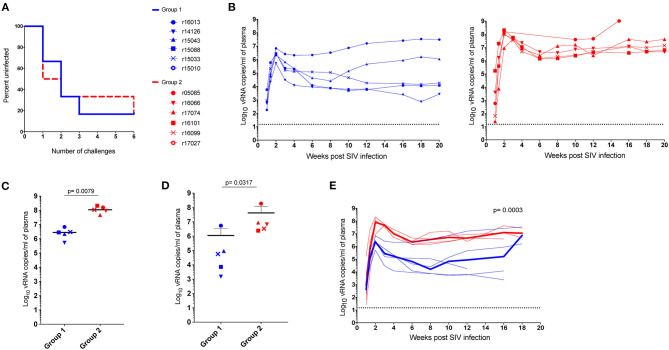
Figure 4.
Outcome of SIV challenge. Two years after vaccination, vaccinees and controls were intrarectally challenged with a low dose of SIVmac239. (A) Kaplan-Meier analysis of SIV acquisition, (B) individual viral loads of Group 1 vaccinees (blue) and the Group 2 (red) RMs. While the difference in acquisition rate was not statistically significant (p > 0.05 by log-rank test), (C) peak, and (D) setpoint viremia were significantly lower for vaccinees than controls (P = 0.0079 and P = 0.0317, respectively). Peak viral loads were defined as the highest viral load measurement within the first 4 weeks post-infection. Chronic phase setpoint was calculated as the geometric mean of viral load values between 8 and 12 weeks post-infection. (E) Geometric mean viral loads for Group 1 and Group 2 animals (P = 0.0003). Of note, we did not identify any correlation between the level of Env-binding Abs on the challenge day and take of the infection. P-values were determined using the Mann-Whitney U test.

