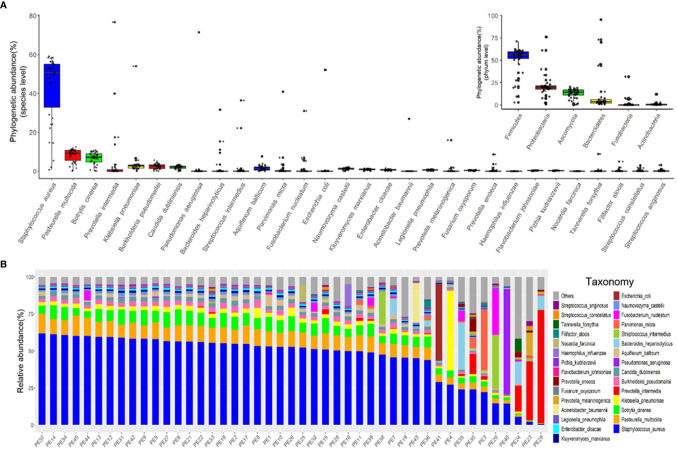
Figure 1.
The major microbiome taxa at the phylum and species levels in the pleural effusion samples. (A) Box plot of species abundance variation for the 30 most abundant species as determined by read abundance. Species are colored by their respective phylum (see inset for color key). Inset displays the box plot of abundances at the phylum level. (B) Stacked bar plot of the 30 most abundant species in the pleural effusion microbiome.

