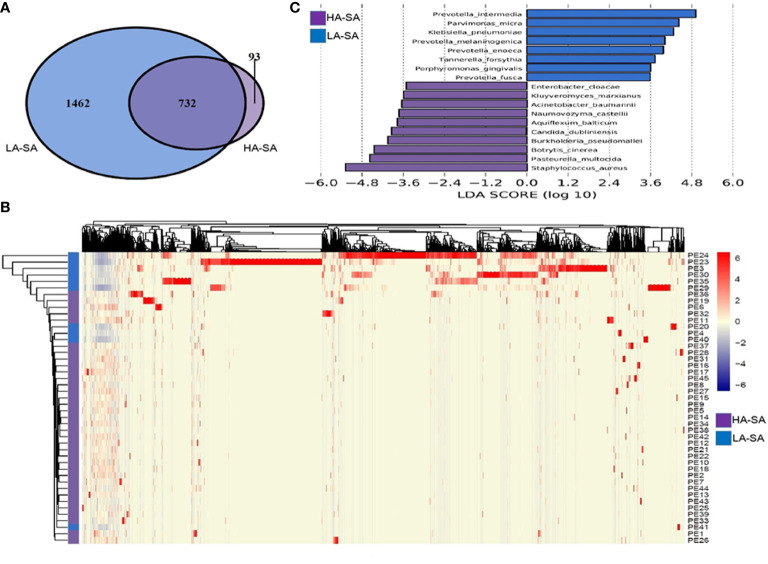
Figure 3.
Comparison of pleural effusion microbiome composition among the HA- and LA-SA types. (A) Venn diagram showing the number of shared and unique species in the HA- and LA-SA group. (B) Heat map of the microbiome species composition for all samples. The abundance of each species was clustered to represent a heatmap. (C) Differentially abundant species were identified using linear discriminant analysis (LDA) coupled with effect size measurements (LEfSe). The cutoff value of the linear LDA was ≥3.5.

