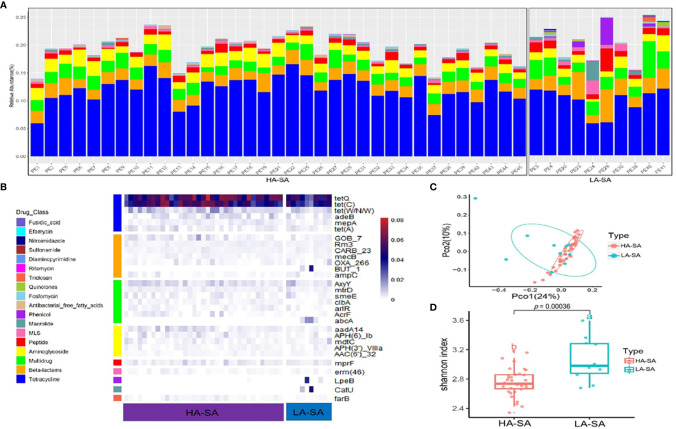
Figure 4.
Abundant ARGs in the pleural effusion microbiome. (A) Stacked bar plot of antibiotics resistant classes in the pleural effusion metagenome. (B) The 30 most abundant ARGs in the HA- and LA-SA type were displayed by heatmap. (C) Principal Coordinate Analysis. ARG composition is independent of microbiome community composition. (D) Diversity estimates of detected resistance features. Significant differences in Shannon diversity estimates of different resistance features of the CARD database inside the HA- and LA-SA type.

