Figure 4.
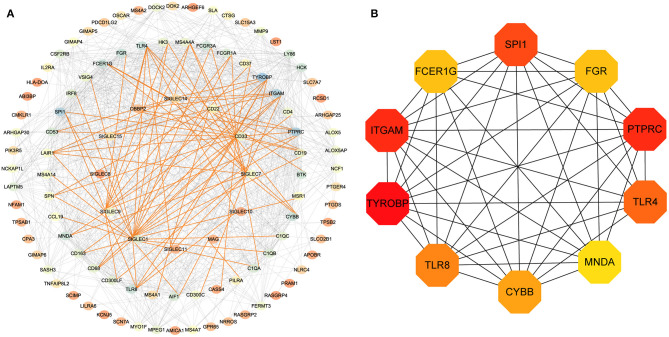
PPI-network analysis. (A) Network of proteins encoded by differentially expressed genes in LUAD and related to SIGLEC expression. The gradient of the node color from red to blue represents increases in the number of edges. The red lines represent the direct interaction between SIGLECs and differential genes. (B) According to the connectivity of the network, 10 genes with the highest degrees of connectivity were selected as hub genes.

