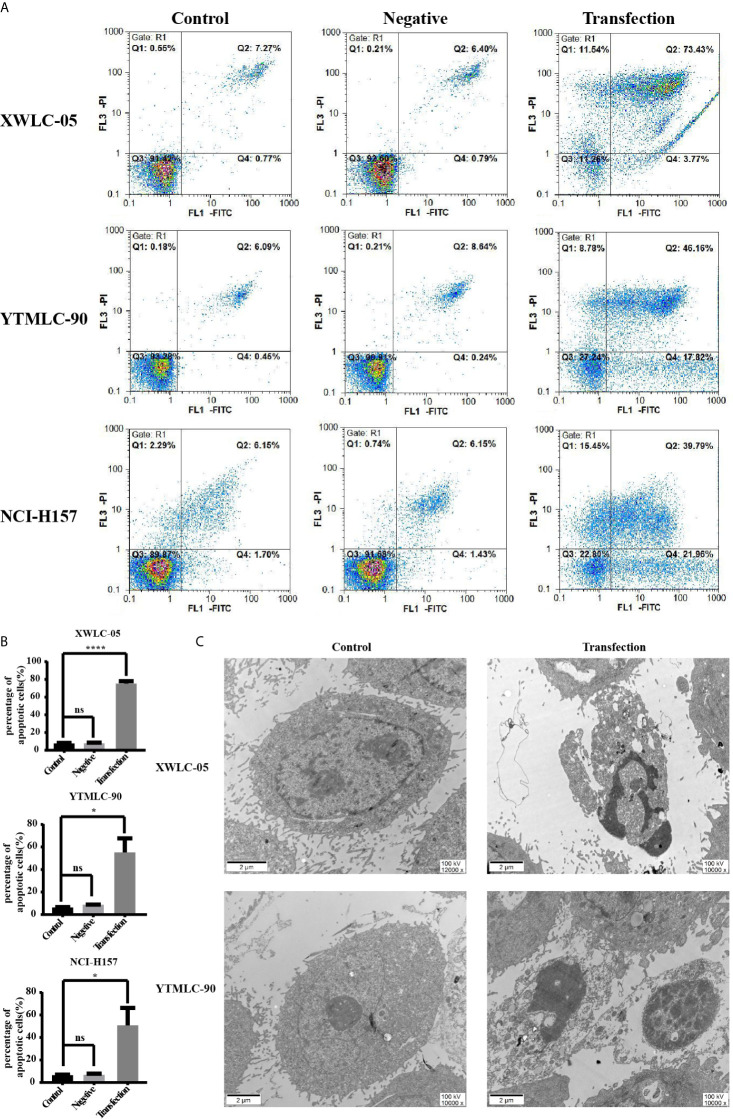
Figure 3.
Apoptosis of cells in each group at a qualitative level. (A) Flow cytometry analysis with Annexin V-PI staining was performed to evaluate the percentage of apoptotic cells in each group. (B) Histograms indicated the percentage of apoptotic cells in each group at 48 h after transfection. The percentage of apoptotic cells in the transfection experimental group was significantly increased compared with that of the controls. Data represented mean ± SD of three independent repeats (n = 3, *P < 0.05, ****P < 0.0001 respectively vs. the bland control and the negative control). ns, statistical significance exist. (C) Overexpression of miR-34a in XWLC-05 and YTMLC-90 cells could cause obvious characteristic features of apoptosis at 48 h posttransfection. The images were taken under the transmission electron microscope (magnifications: 10,000× and 12,000×, scale bar 2μm). Transfection, the pGCMV/EGFP-hsa-miR-34a plasmid transfection experimental group. Control, the blank control group.

