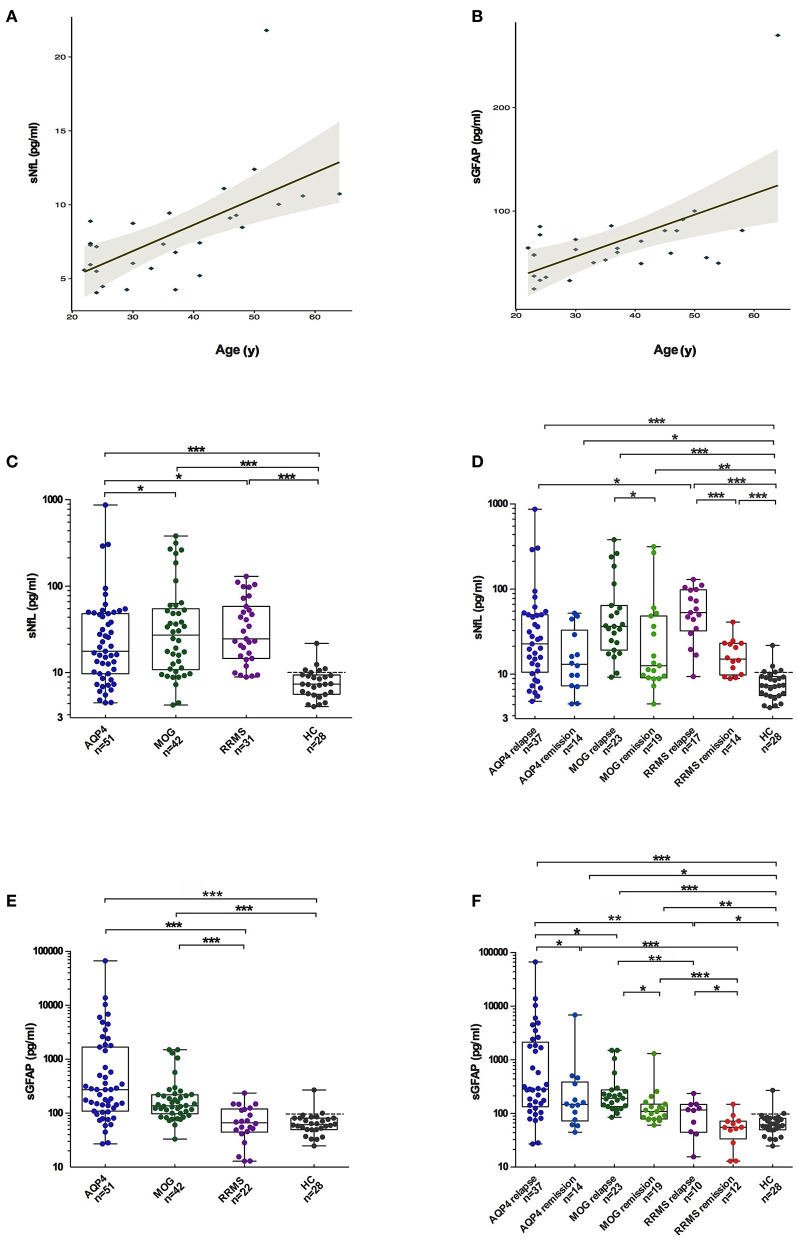
Figure 1.
Comparisons of sGFAP and sNfL levels among the different groups. (A,B) Correlations of sNfL and sGFAP levels with age in HCs. (C,E) sNfL and sGFAP levels were compared among all the samples from patients with AQP4-antibody-positive NMOSD, MOGAD, and RRMS, as well as from HCs. (D,F) Samples from the three disease groups were divided into relapse and remission stages and were compared. Boxes depict the median and interquartile range (IQR), with the median represented by the line in the center, and whiskers extending from minimum to maximum values. The dotted lines represent the 90th percentiles of sNfL or sGFAP concentrations in HCs. sNfL, serum neurofilament light; sGFAP, serum glial fibrillary acidic protein; HC, healthy control; AQP4, aquaporin 4; NMOSD, neuromyelitis optica spectrum disorders; MOGAD, myelin oligodendrocyte glycoprotein-antibody-associated diseases; RRMS, relapsing-remitting multiple sclerosis. The p-values were obtained with a mixed-effect model adjusted for age and EDSS scores (*p < 0.05, **p < 0.01, and ***p < 0.001). In the figure, AQP4 stands for AQP4-antibody-positive NMOSD; MOG stands for MOGAD.

