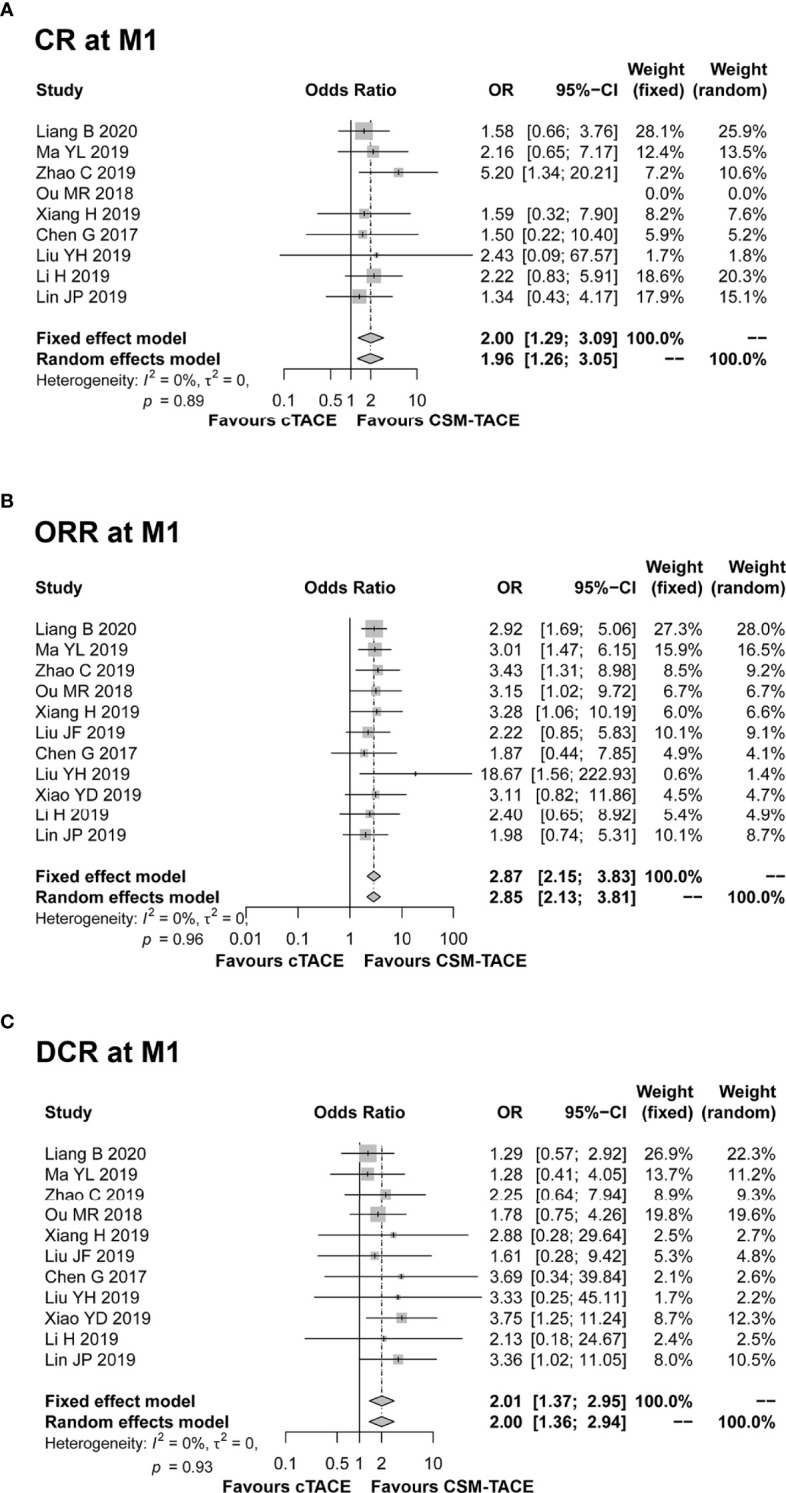
Figure 2.

Forest plot comparing CR at M1 (A), ORR at M1 (B), and DCR at M1 (C) between CSM-TACE treatment and cTACE treatment. CR, complete response; M1, 1 month; ORR, objective response rate; DCR, disease control rate; CI, confidence interval; cTACE, conventional transarterial chemoembolization; CSM-TACE, CalliSpheres® microspheres transarterial chemoembolization.
